One Day At A Time
  • One Day at a Time
  • Portfolio
  • Graduate Work Portfolio
  • TechReadyPD

EmPowerAppsment

11/26/2019

2 Comments

 
​Empowerment has been a popular EDU buzzword for quite sometime now. Usually when I see it in my twitter feed, the term is being used in conjunction with "students"; "Empower students to do X with Y". Empowerment isn't a word I use loosely because of it's #EDU buzzy-ness, but I couldn't help myself using "empowerment" days ago while presenting at the 2019 CETPA (now CITE!) conference.
Picture
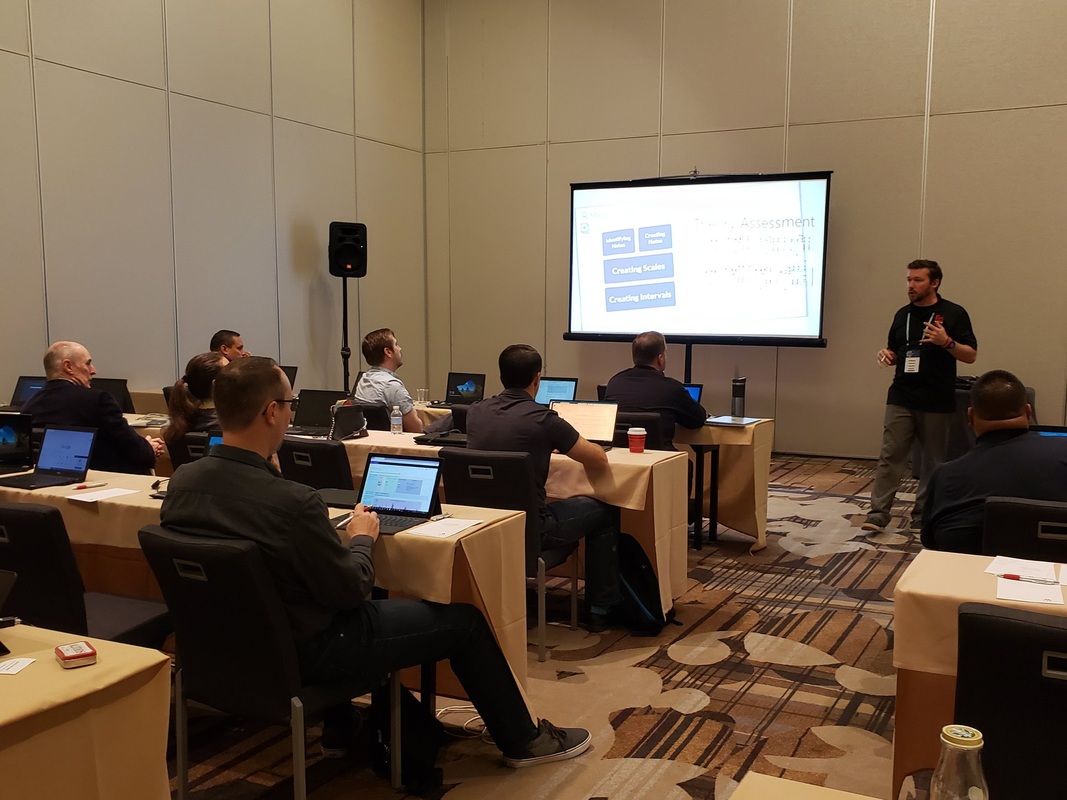
8am PowerAppers at CETPA 2019
​My session wasn't focused on empowering my students through, it was showing the empowering capabilities of PowerApps. I've been using PowerApps in my music classroom for over a year now, and like other EdTech tools I've adopted over the years into my pedagogy (Surface, Miracast, OneNote, Power Bi), I can't see myself teaching day to day without it.

I was fortunate to have the expertise of Brian Dang (@8bitclassroom) on hand for my presentation. Without his help a couple summers ago, I'd still be using  less efficient methods to track my inventory and student achievement.
Picture
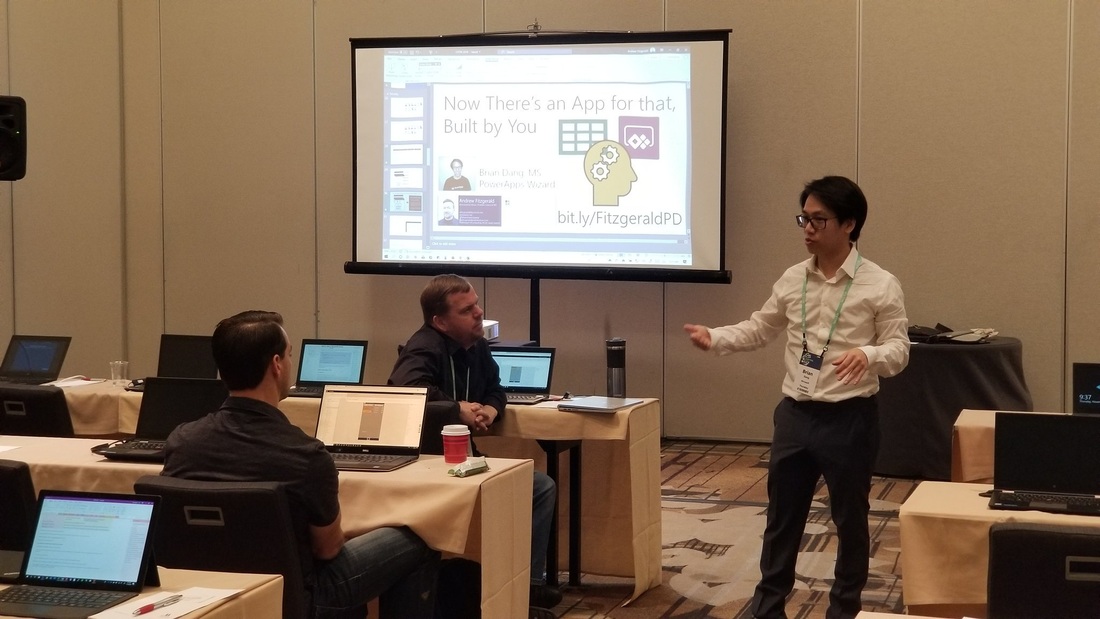
Mr. PowerApps Brian Dang

​Inventory

Picture
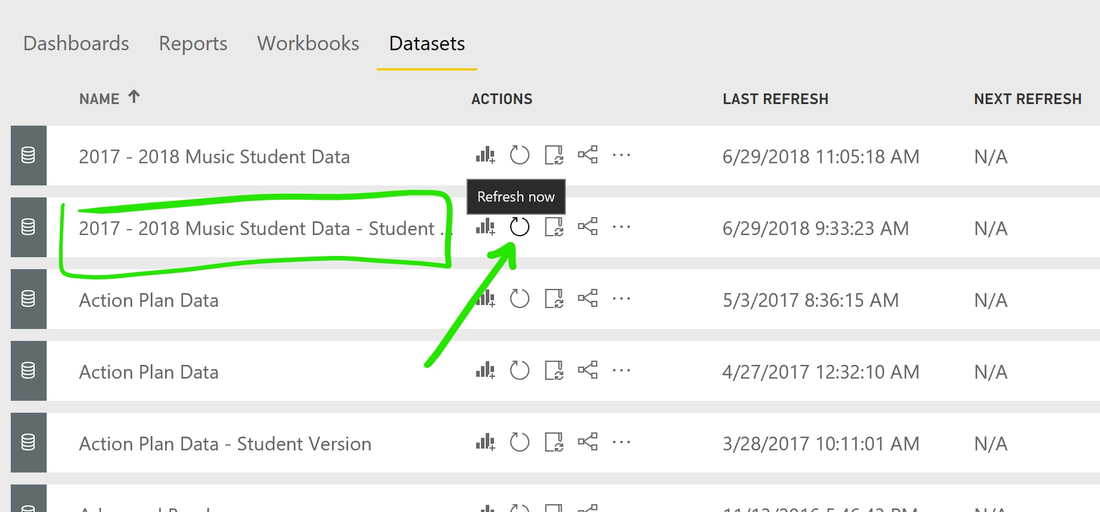
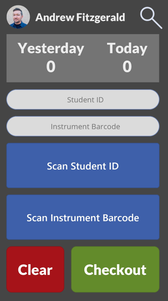
Barcode Scanner I run on my phone after school for checkouts
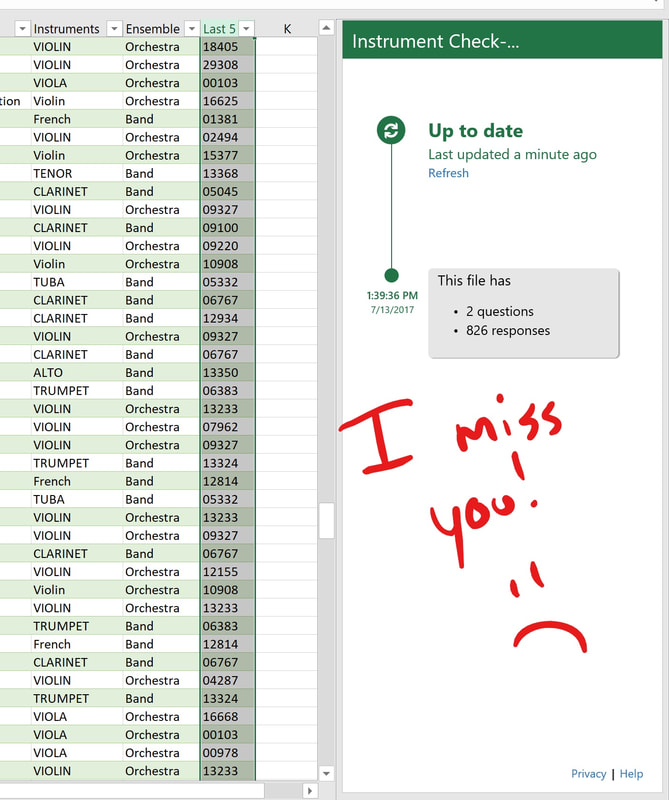
​With PowerApps, I have applications for assigning, tracking, and turning in my classroom inventory with my 240 students. This includes 160+ shared band and orchestra instruments, 250+ method books, instrument accessories, and 300+ classroom iPads. This is nothing new for a music teacher, it's just a part of the job. My previous methods included pencil/paper or a spreadsheet, but that was tedious, cumbersome, and ate up a lot of my prep and class time. There is probably some 3rd party inventory tracking service I could pay for, but I don't have the ca$h for that. With PowerApps, I was able to create my own custom inventory applications, designed to my liking that captured the specific data points I needed. It's a WIWIWIG (What I Want Is What I Get) platform. Sure, you can argue that every dev platform is like that, but the PowerApps Low-Code learning curve is so much easier for my busy teacher/husband/father lifestyle. 

Picture
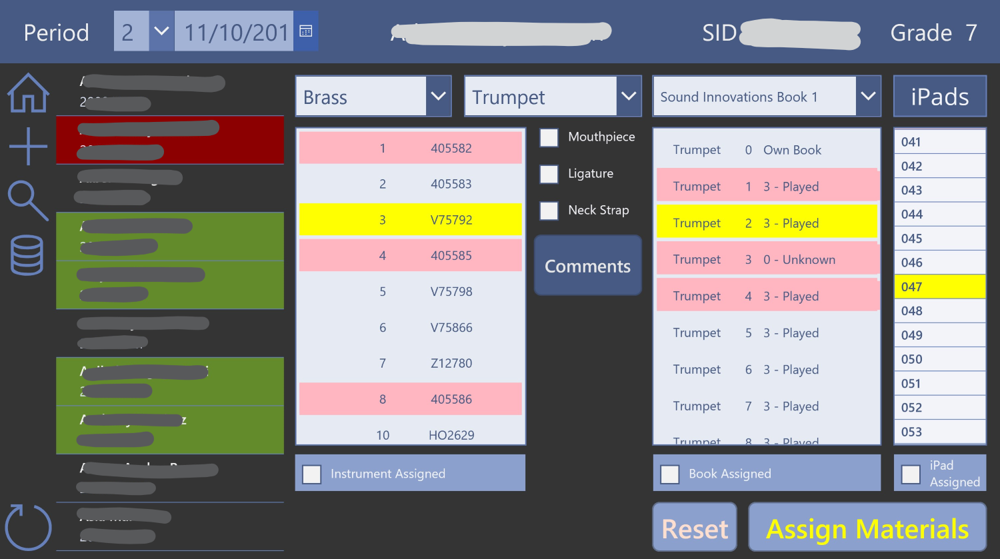
PowerApp for assigning classroom inventory
Picture
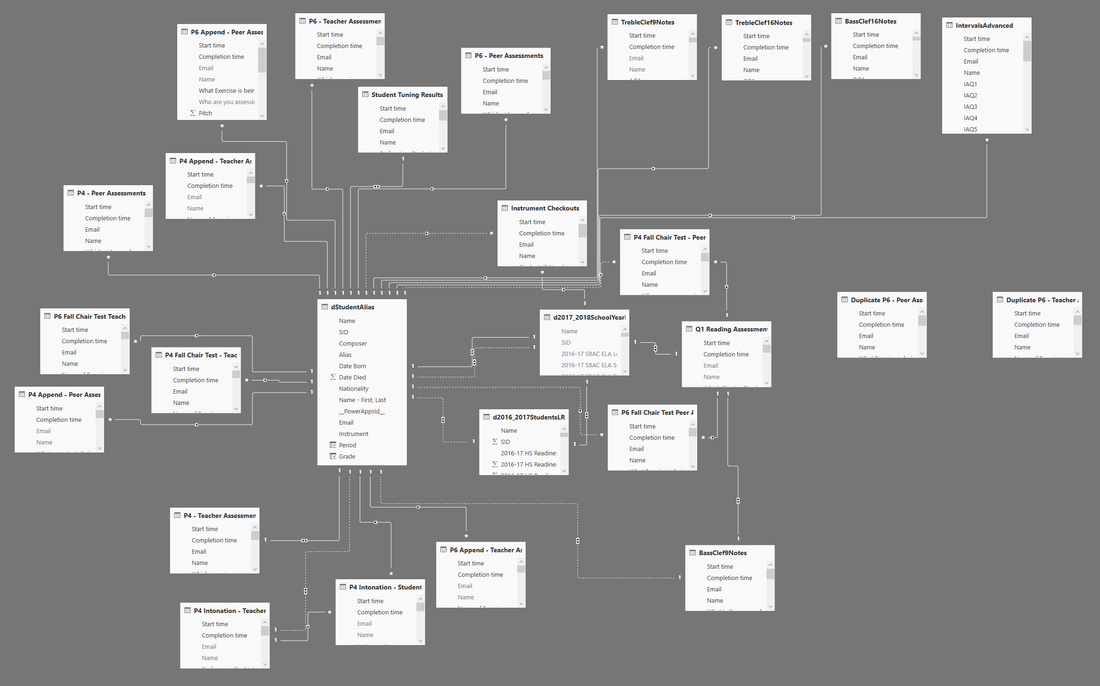
Look at all the data!

Music Theory

I teach my middle school students Music Theory. Short answer: Music Notation is brand new language and ya gotta hit all 4 domains of language acquisition. Just say'n. Resources for practicing and reinforcing the concepts and skills I teach my students are limited, and will cost me more money to get more. I have my lessons and worksheets for students to practice on, but having to recycle them with my students I see for 3 years just feels bad. My 8th graders will get a worksheet they completed in 6th and 7th grade and that's because that's all I have ¯\_(ツ)_/¯. Sorry not sorry, and I'm not going to TPT to buy a some worksheets that are lacking the rigor I'm looking for. ​
Picture
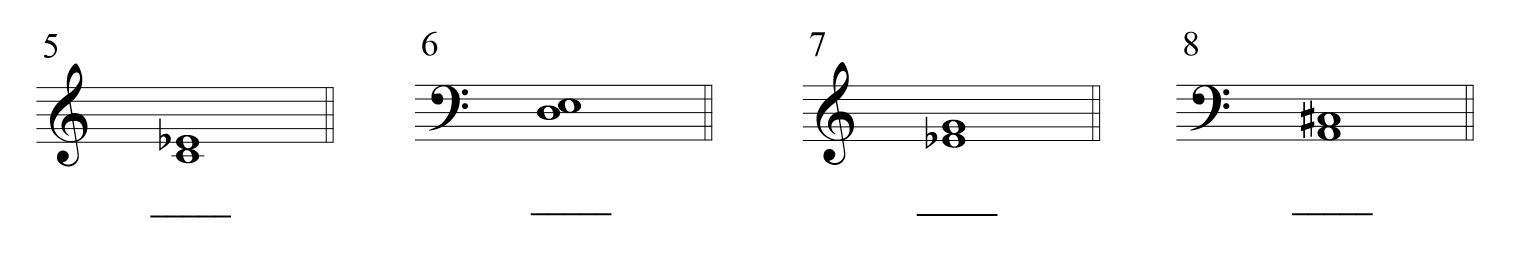
Identifying notes on the Treble and Bass clef
Picture
Creating notes on the Treble and Bass clef
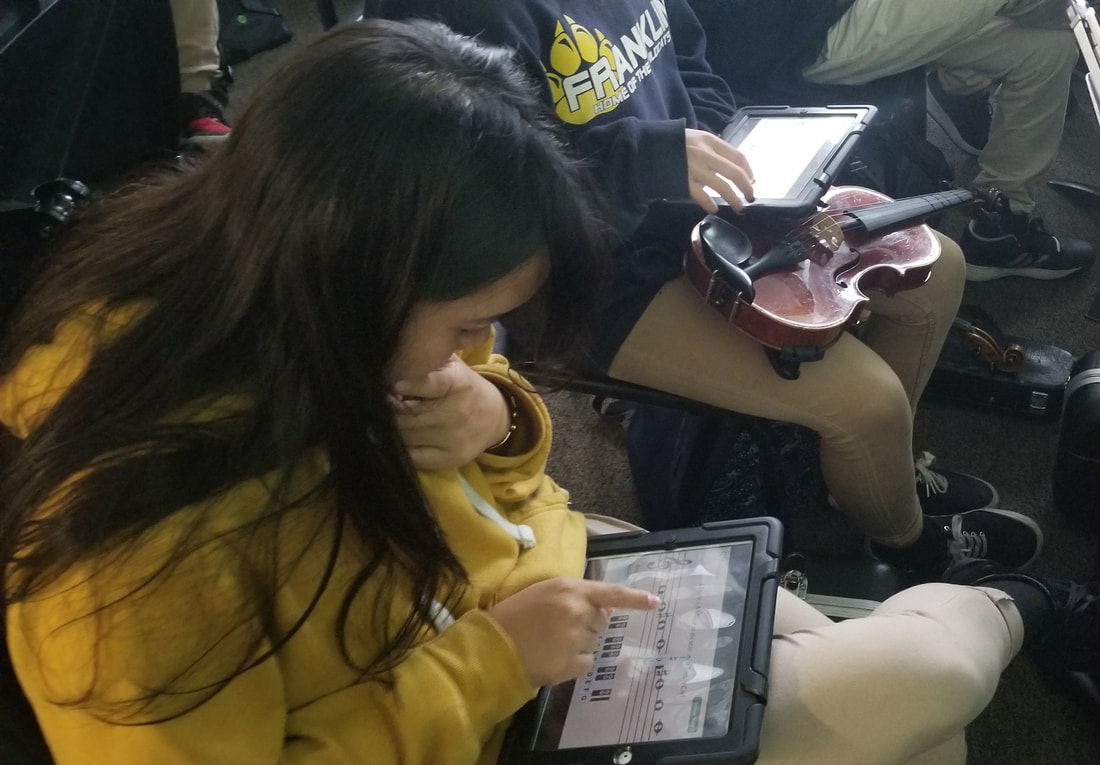
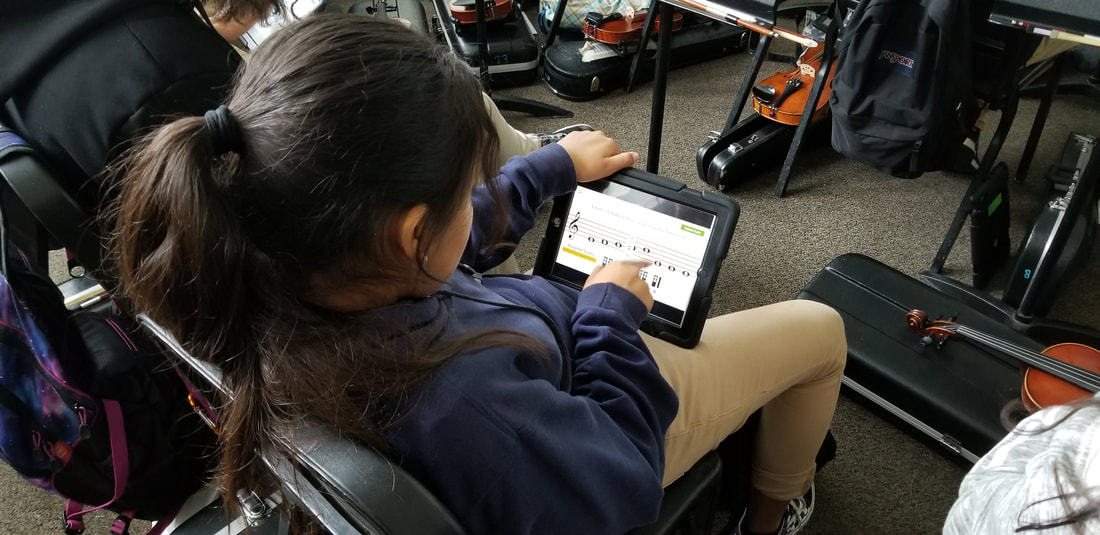
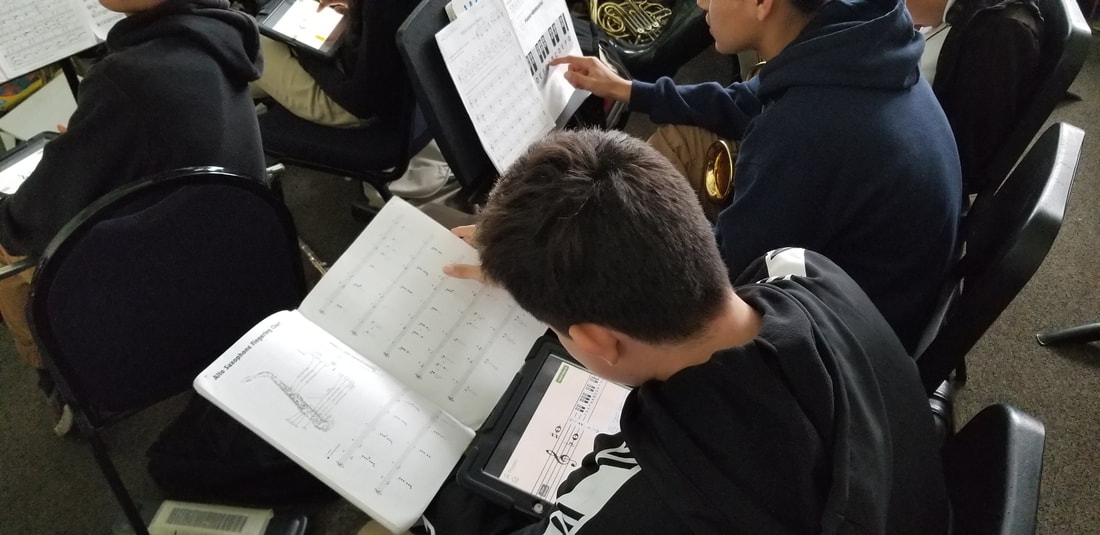
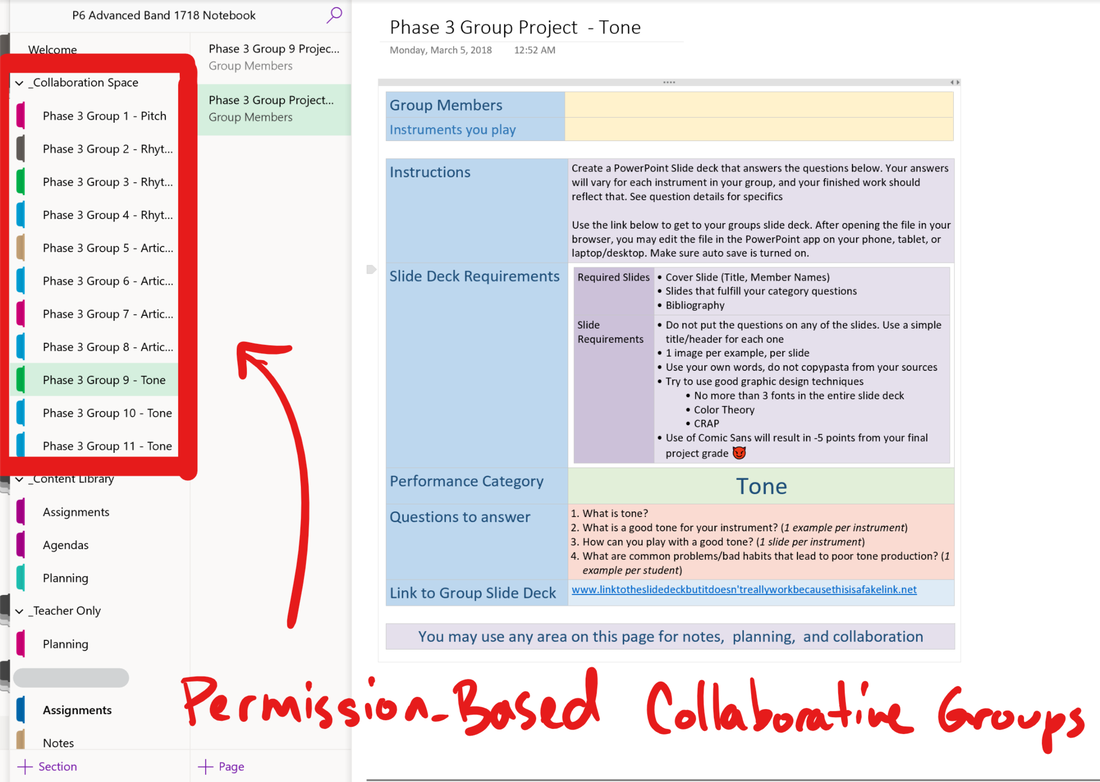
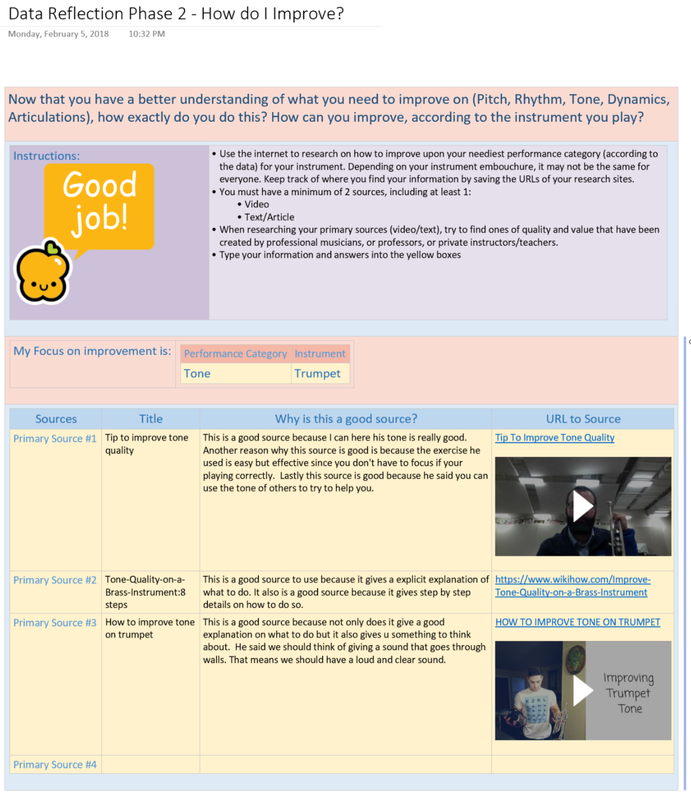
However, since last school year I've been transferring my students' skill/concept practice of music theory over to an application I created in PowerApps. So far I have identifying/creating notes, building scales, and creating intervals. I shared my app to my students via my school's Office 365 tenant, so they just login to the PowerApps app like anything else in 365 and have at it. PowerApps runs on all devices plus the browser, so iPad, phone, whatever, it works. There are so many benefits to what's happening now I have to show you a list:
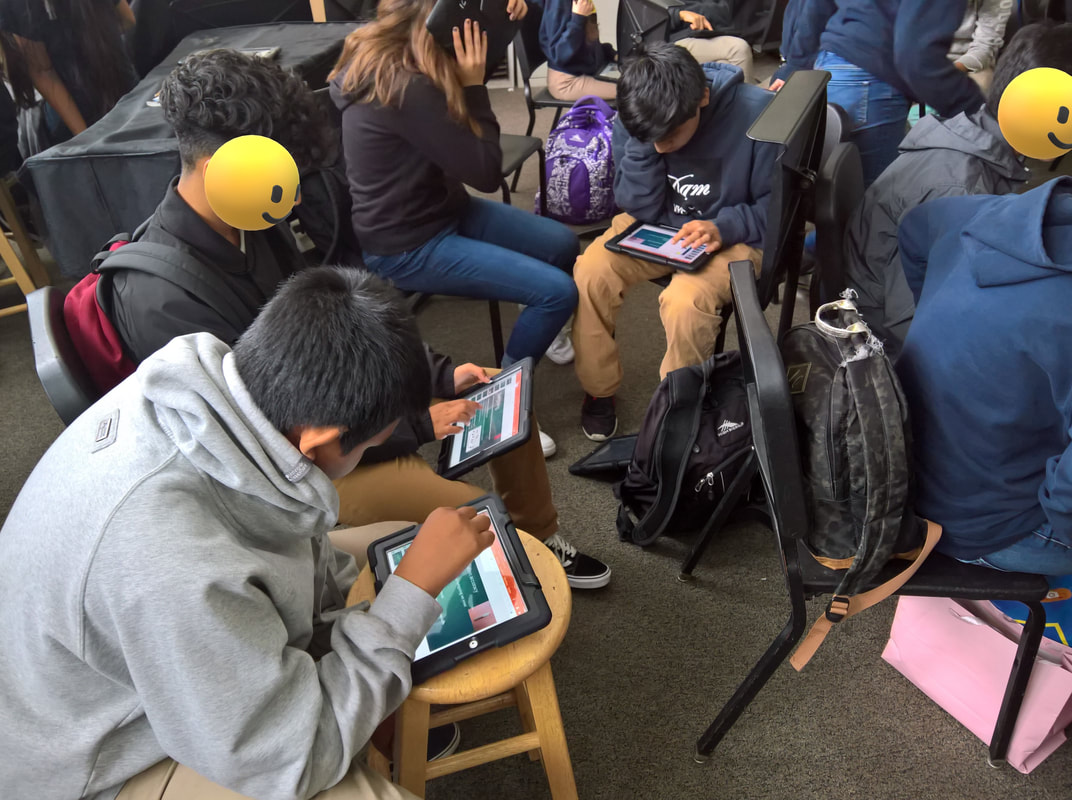
💯 My students have unlimited practice now. In class or at home. Regarding home, I don't assign them to use my app, they just do it themselves at night and over breaks. That's a win for me 😁

​💯 No more paper and trips to the copy room!

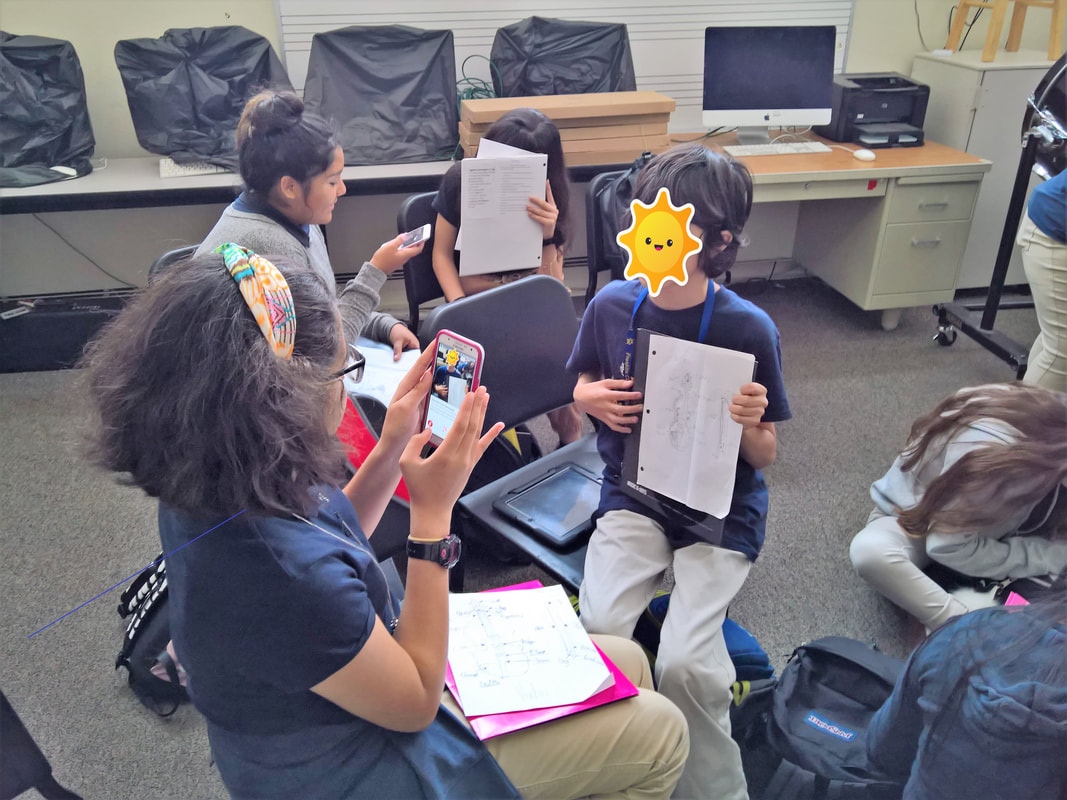
💯 The practice activity questions are randomized, so my students are never answering the same stuff as the student next to them. "Hey, what did you get for the third one?" does not work in my class. Now my students are working together, helping each other, and teaching each other how to get the correct answers.

💯 All the data being collected (student answers) live in my school's Office 365 tenant, not some other 3rd party service.

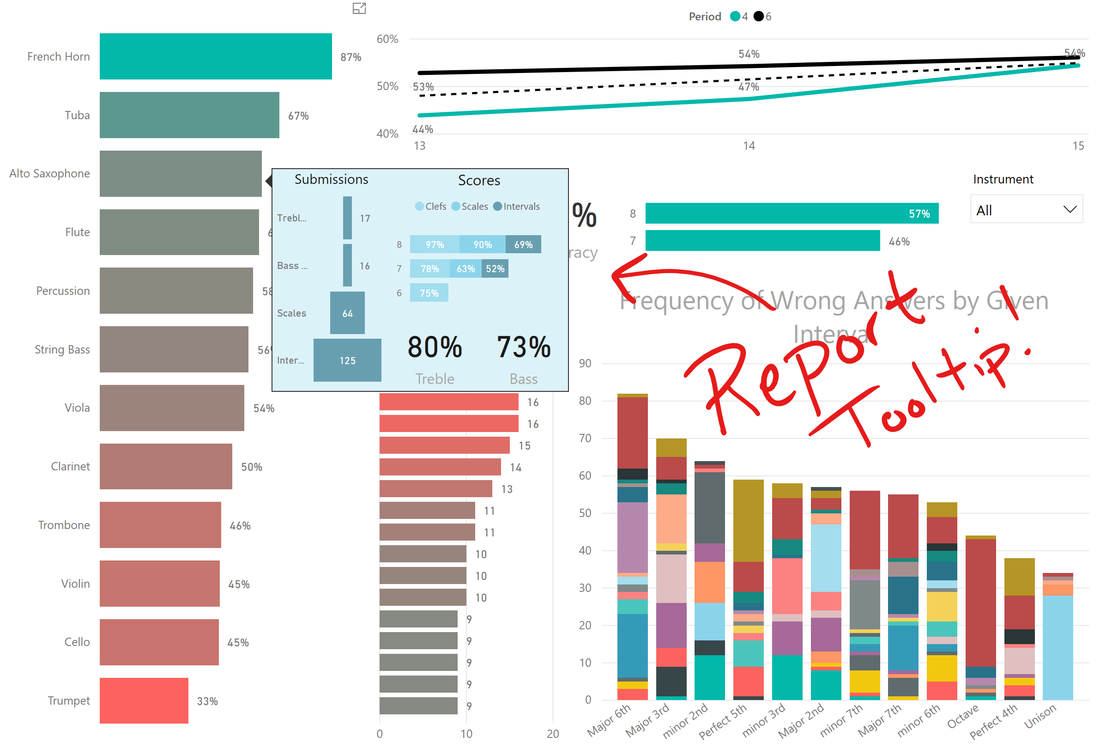
💯 Speaking of data, since PowerApps is WIWIWIG, I design the app activities to capture the data points I'm looking for. Students struggling more with Bass Clef? Ledger Lines? Tri-Tones? Leading Tones? I can see all that because I designed the data output.

💯 Student.Work.Is.Automatically.Graded.

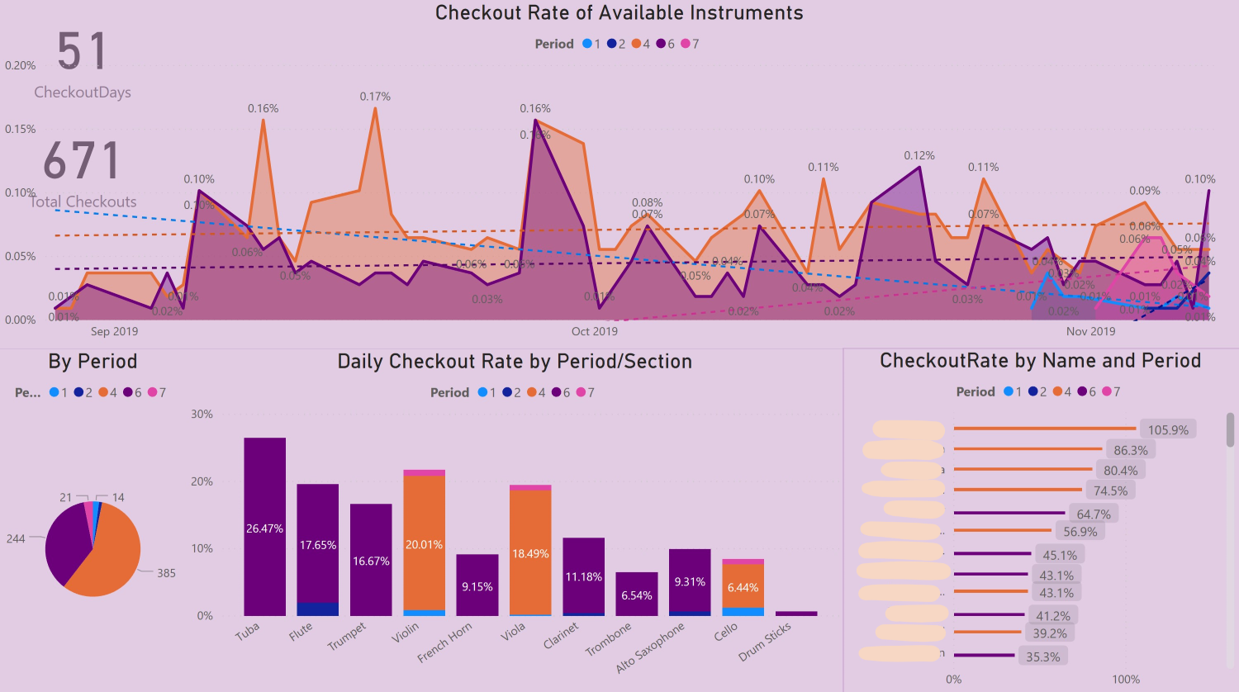
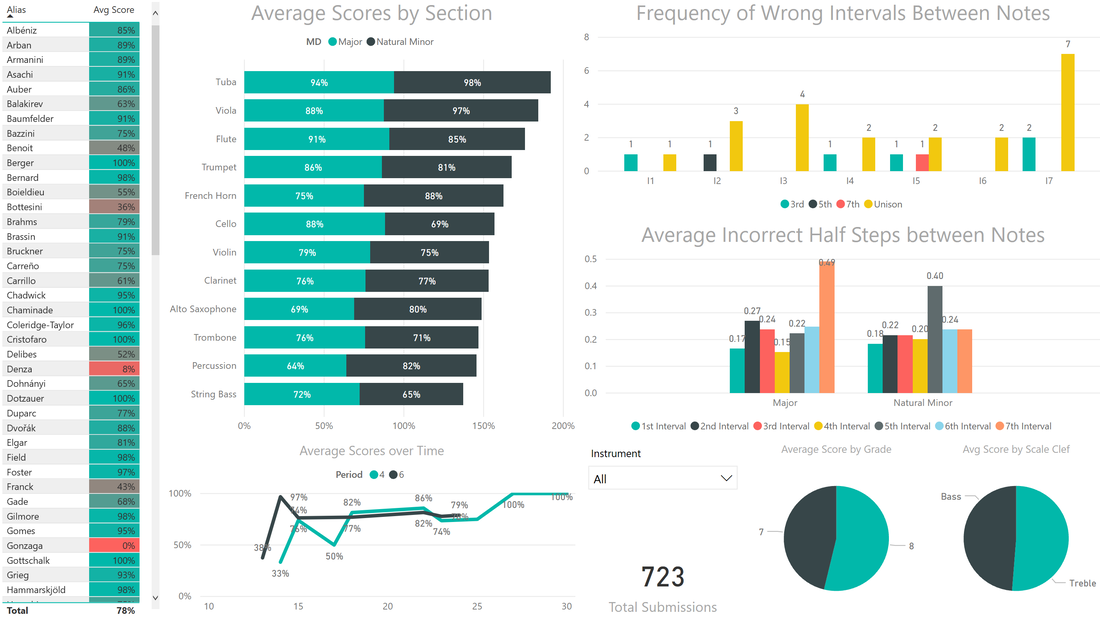
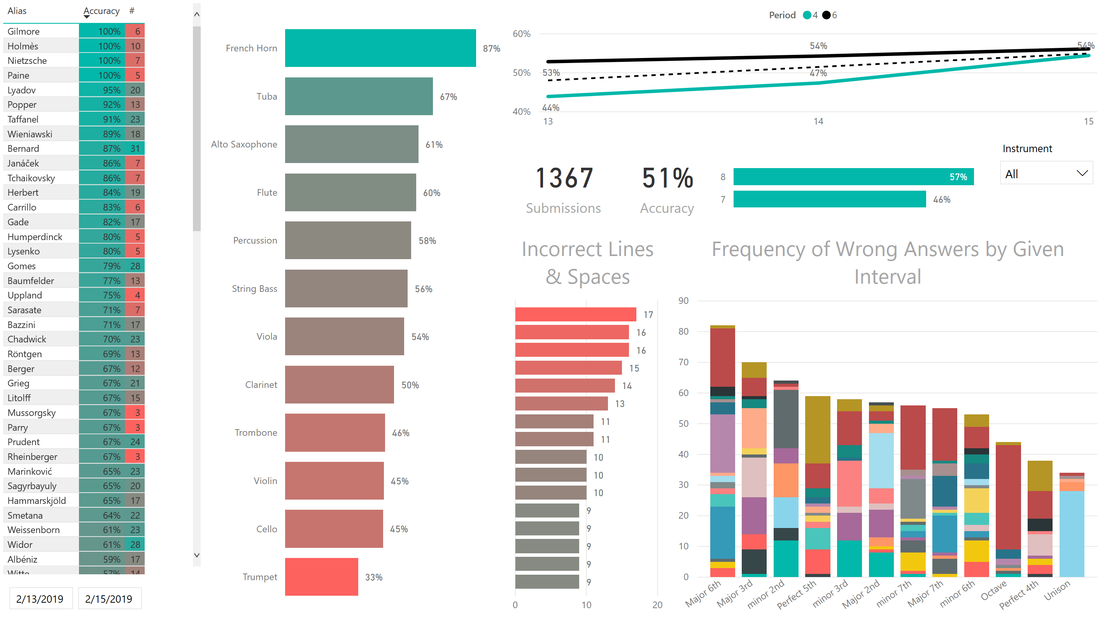
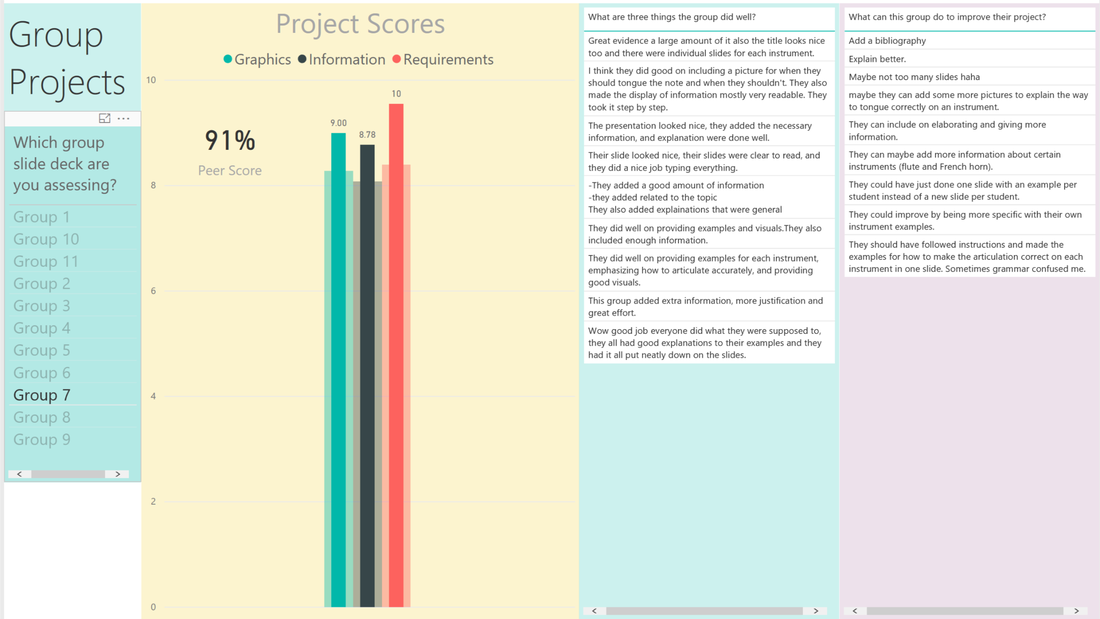
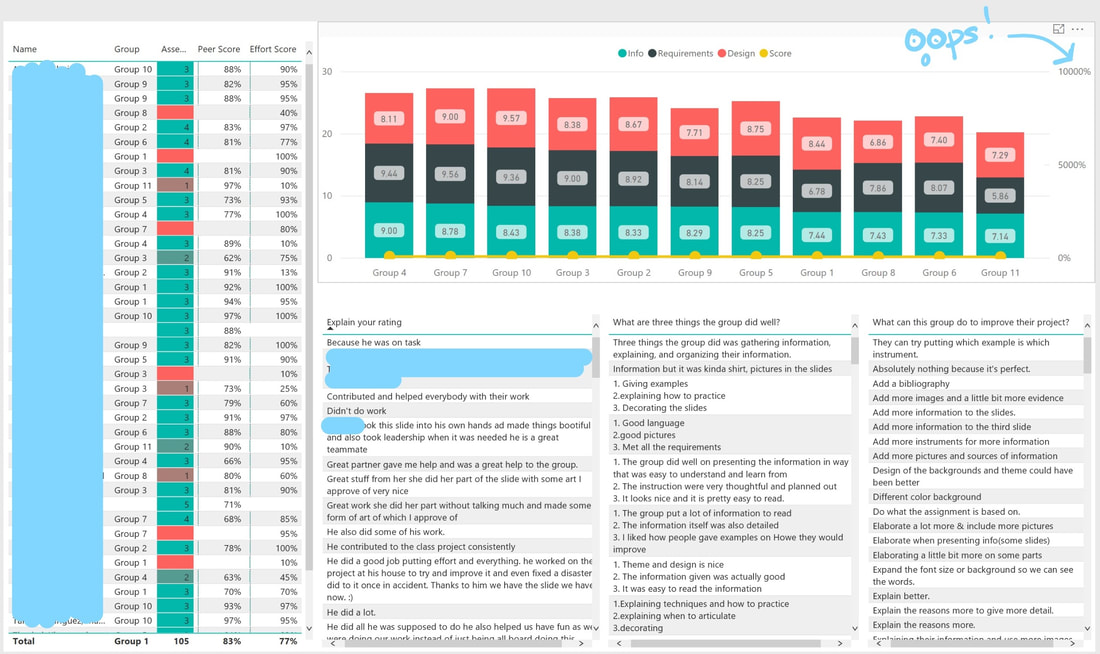
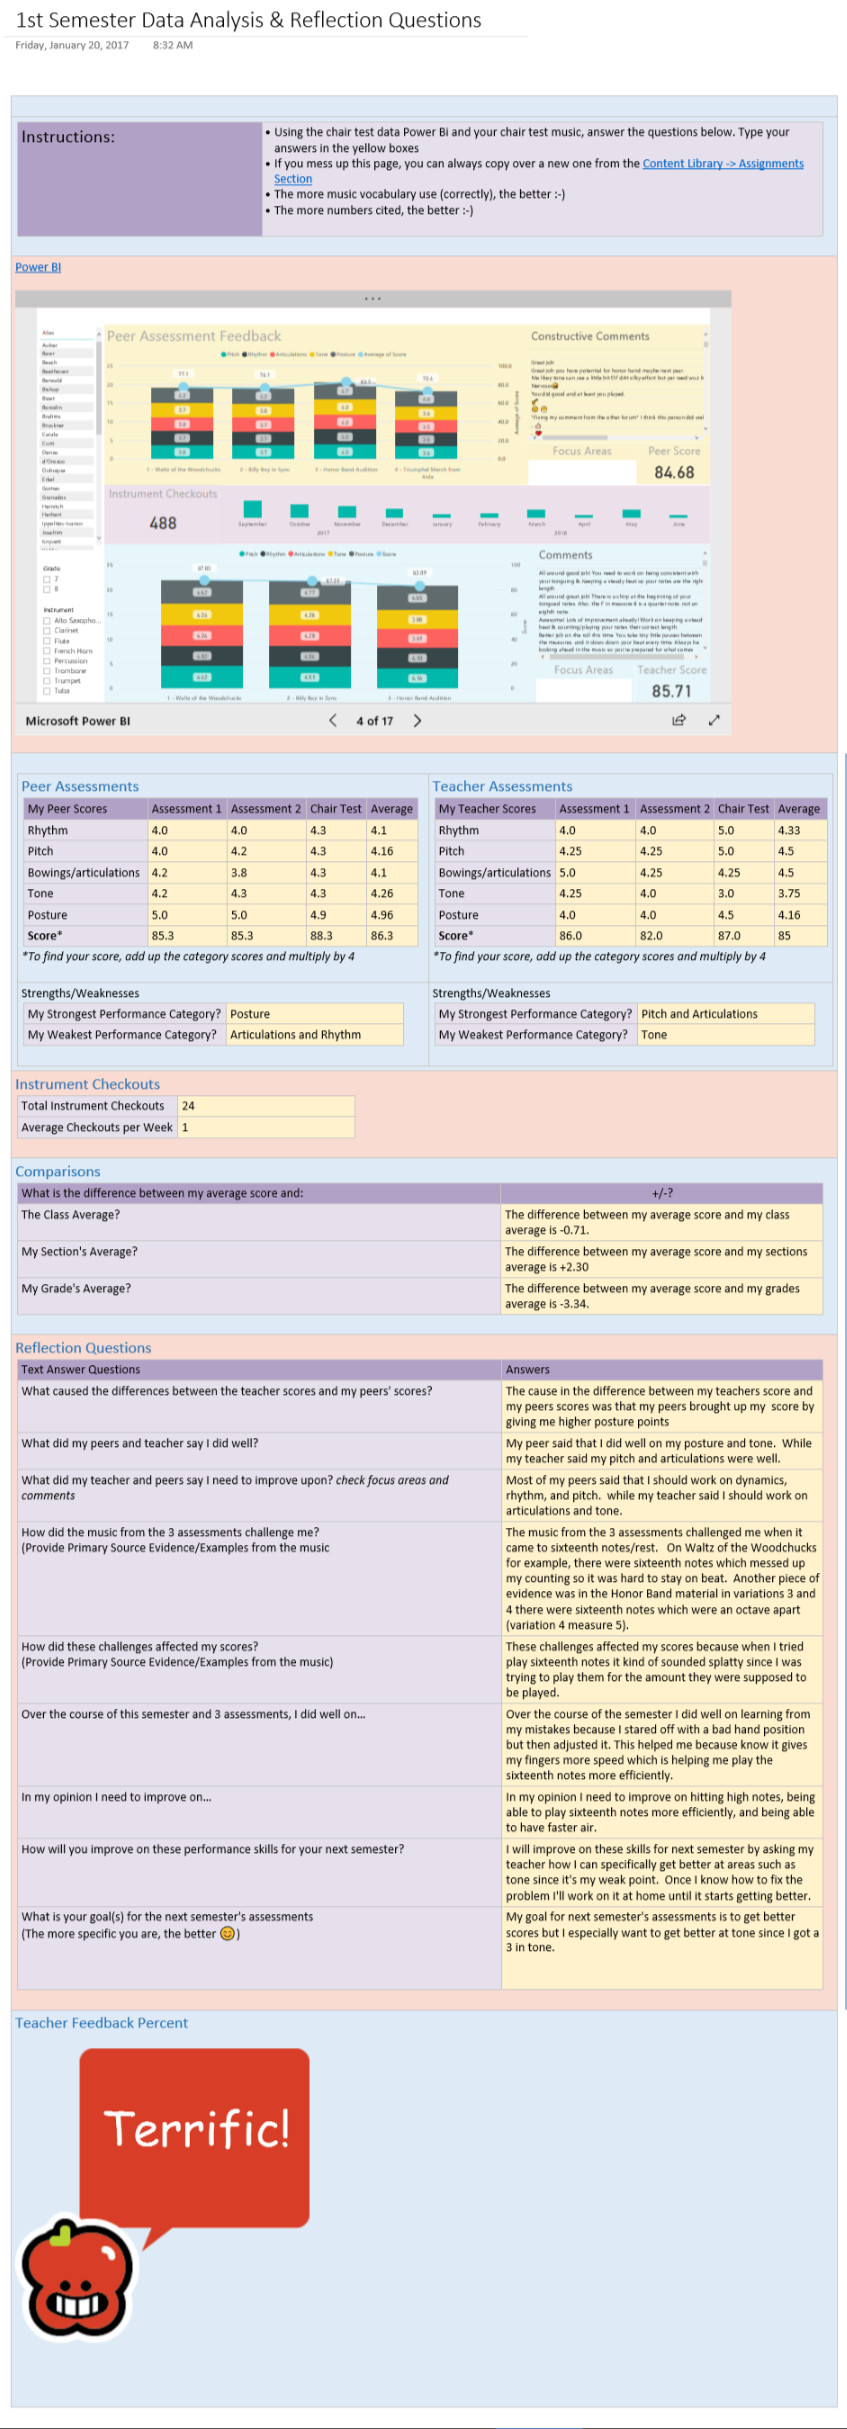
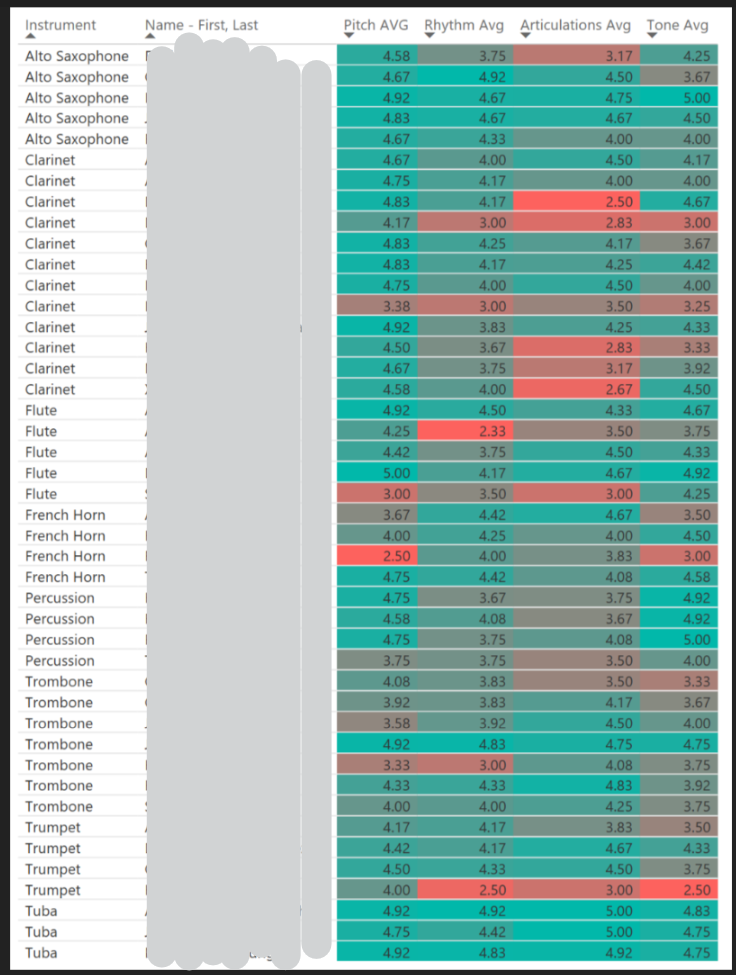
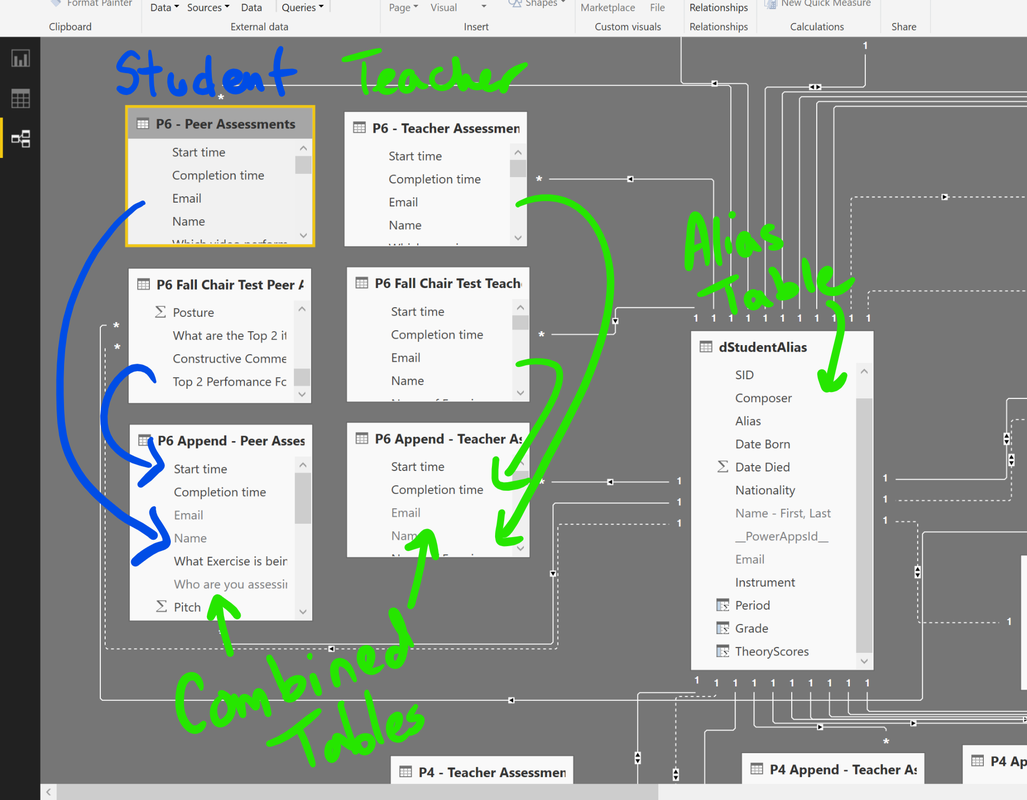
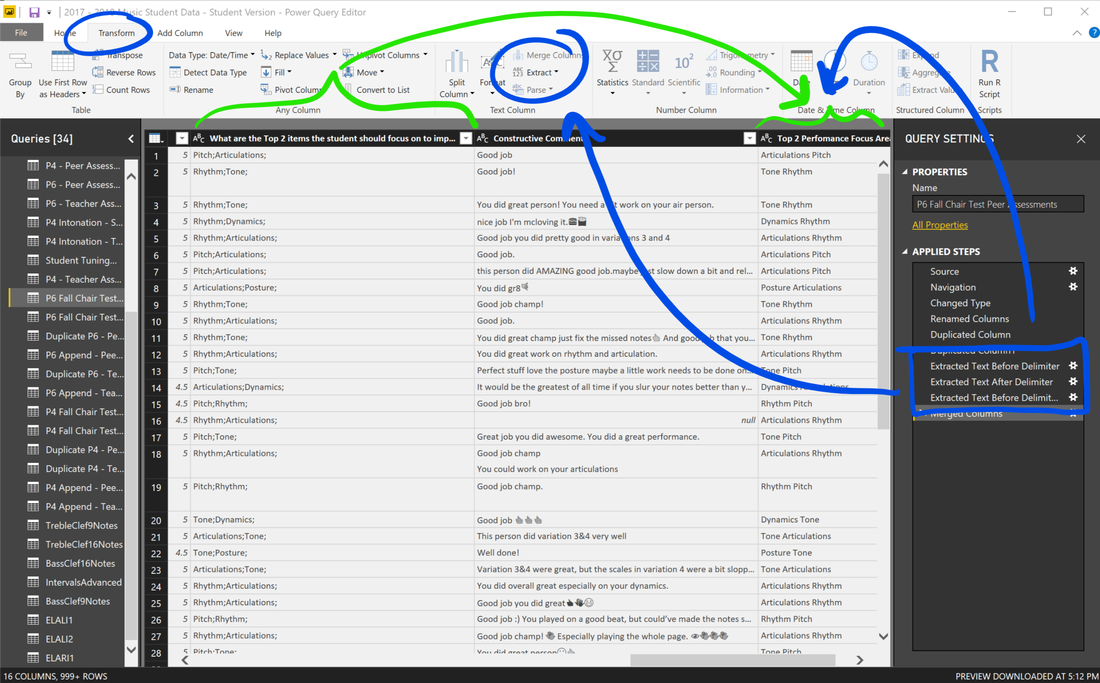
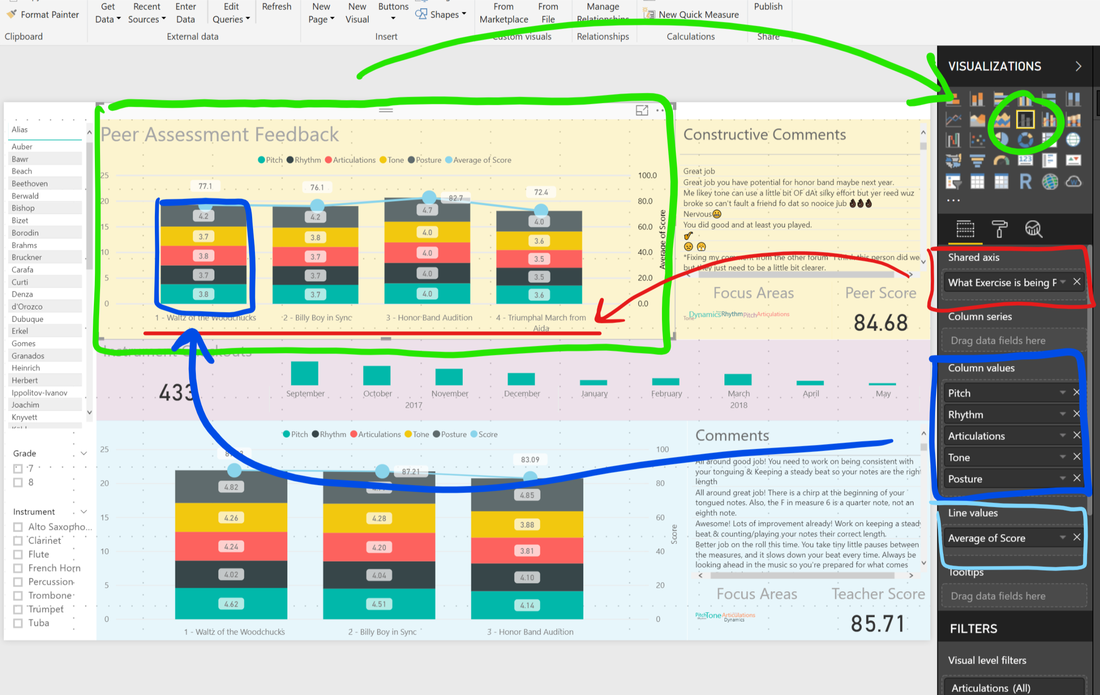
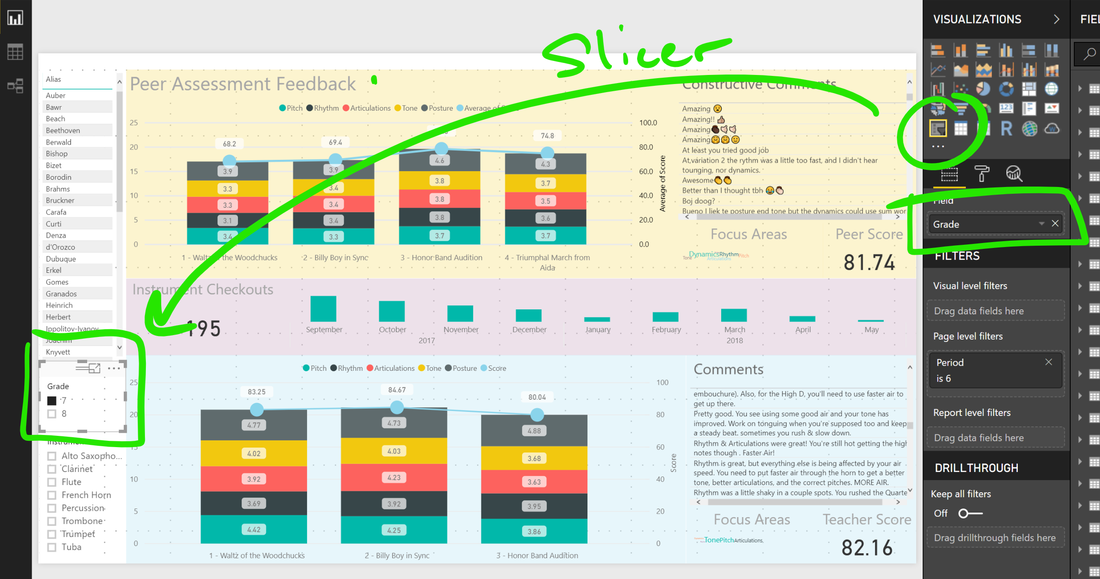
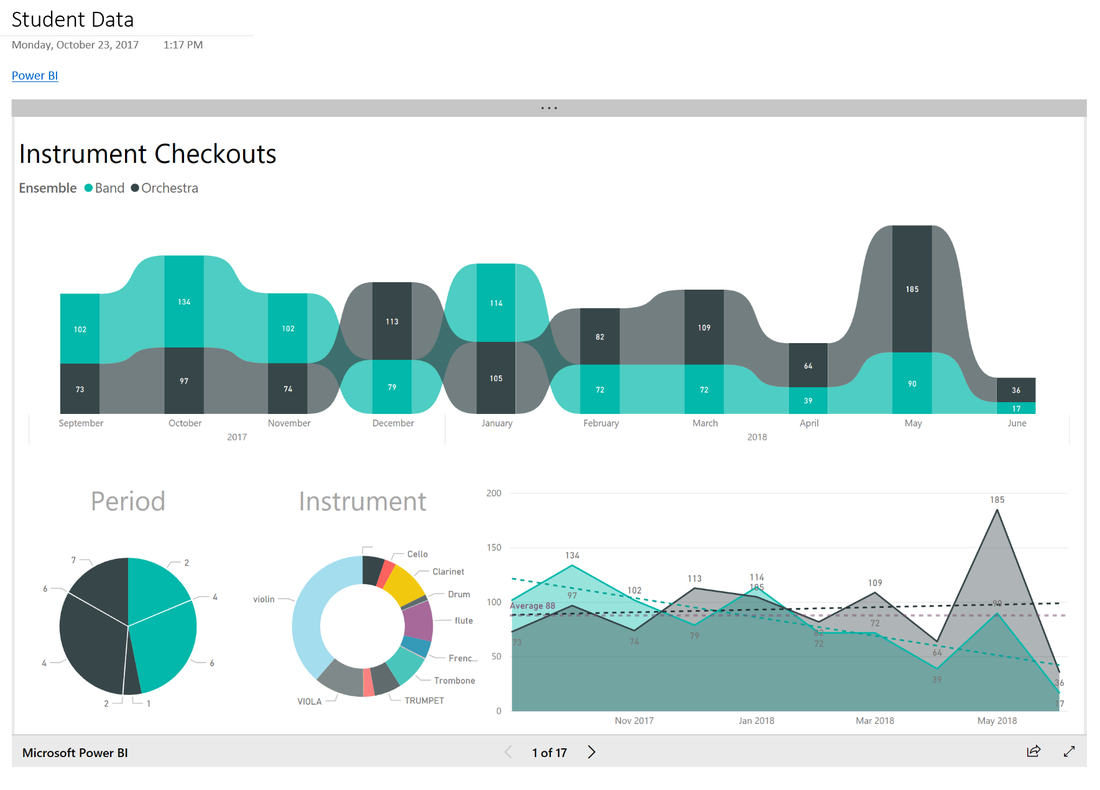
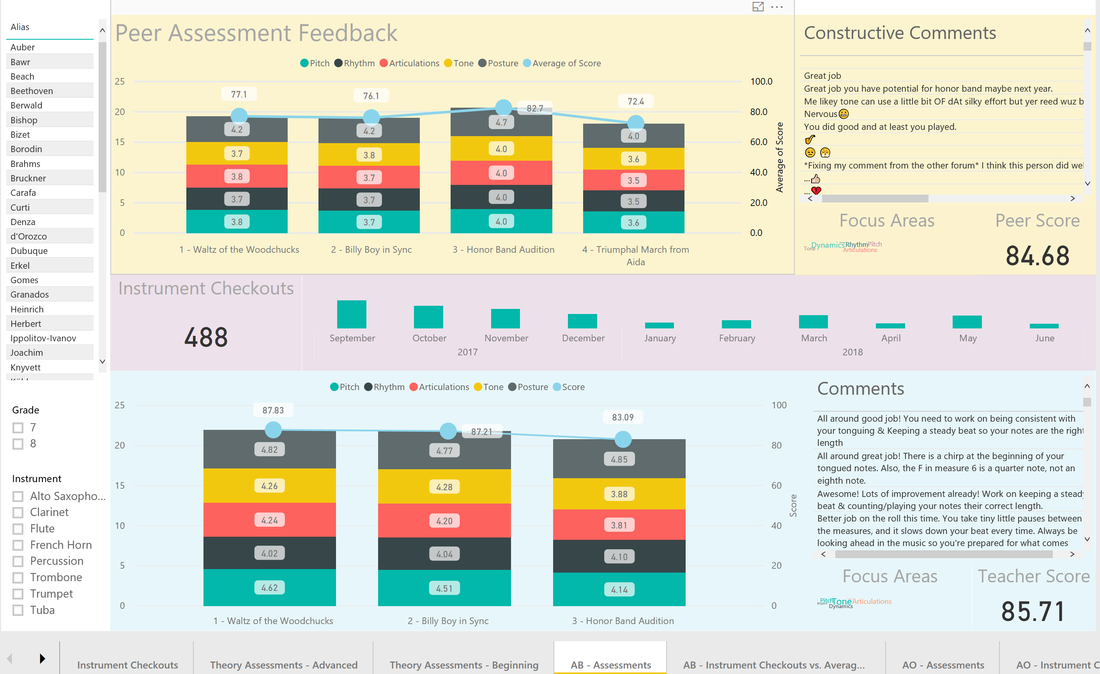
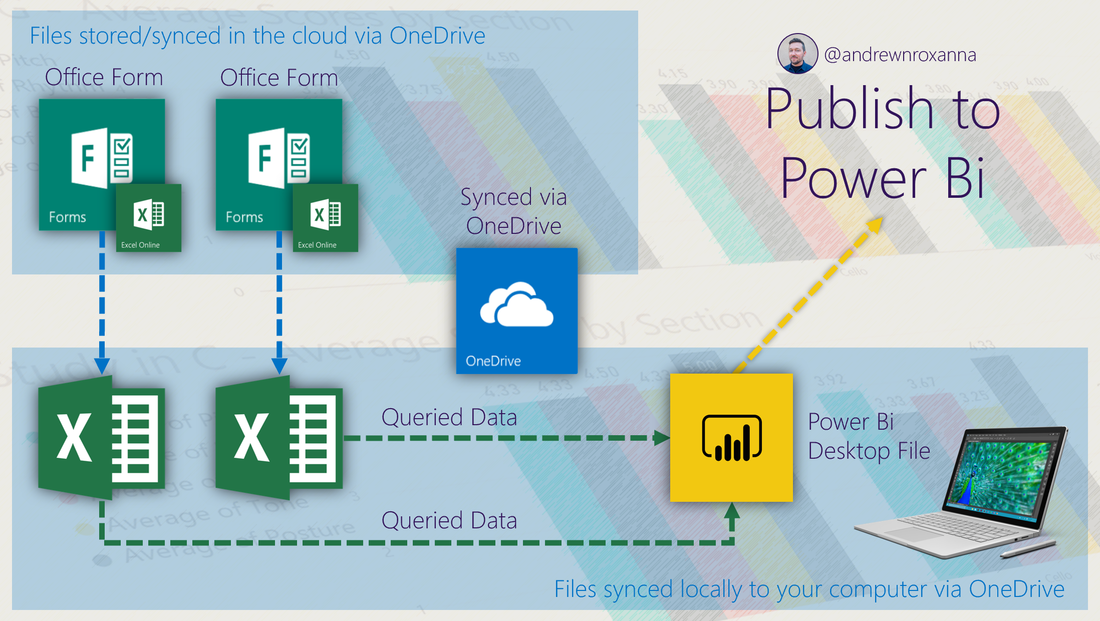
💯 All the data get pumped into Power Bi so I can see how successful my students are doing. I can see trends over time, hotspots in my seating arrangements, and common issues.

💯 All the data is anonymized and shared back with my students to my liking.
Picture
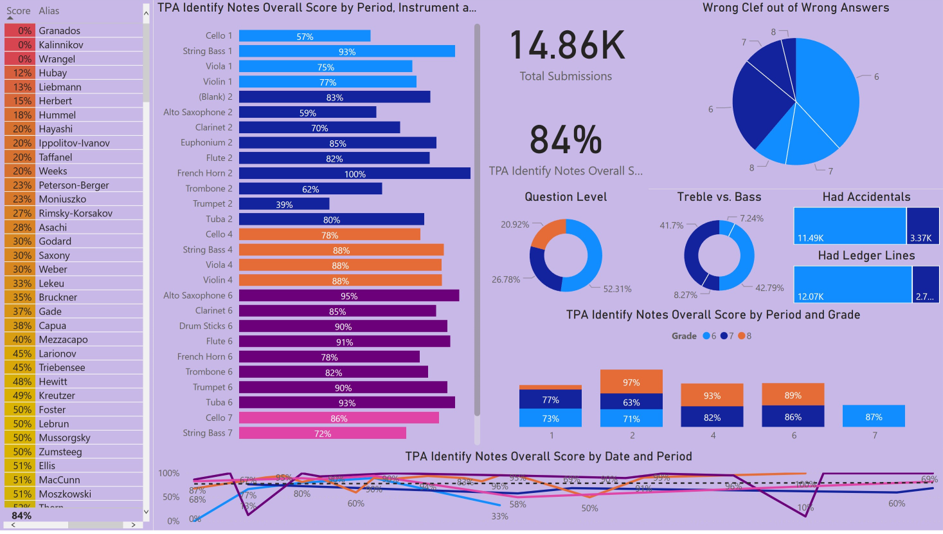
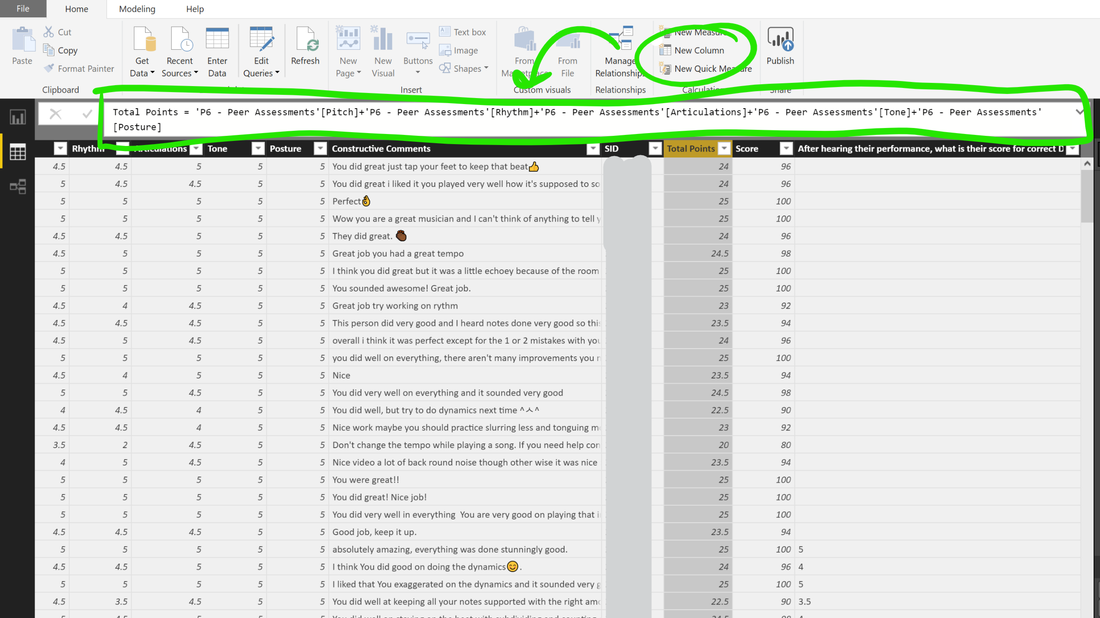
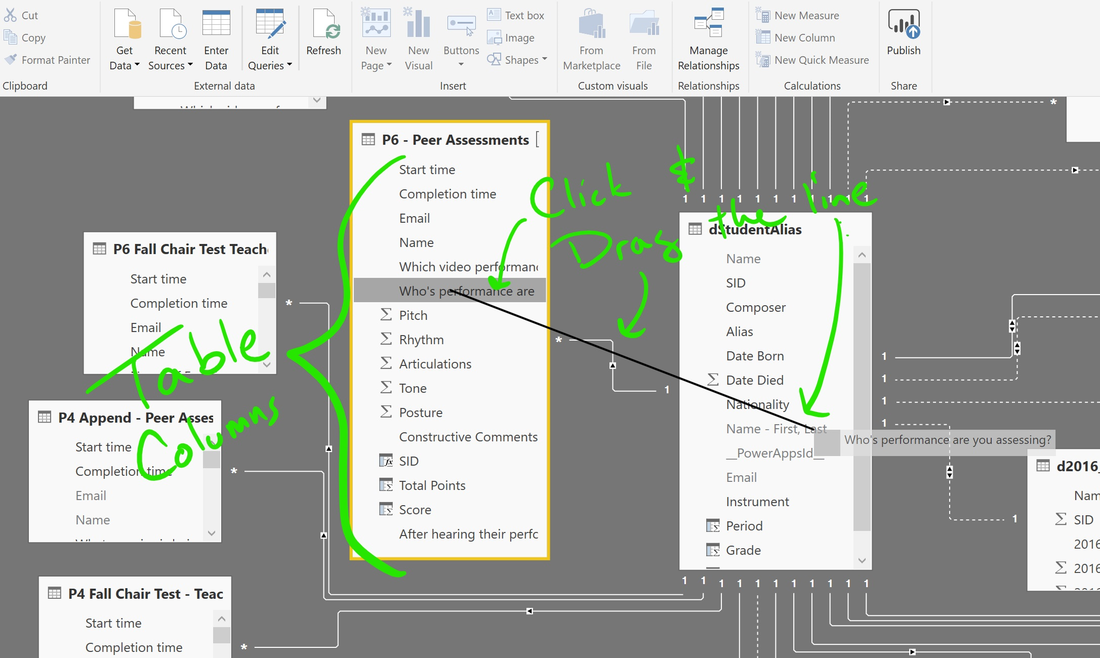
Theory app data gets fed into Power Bi

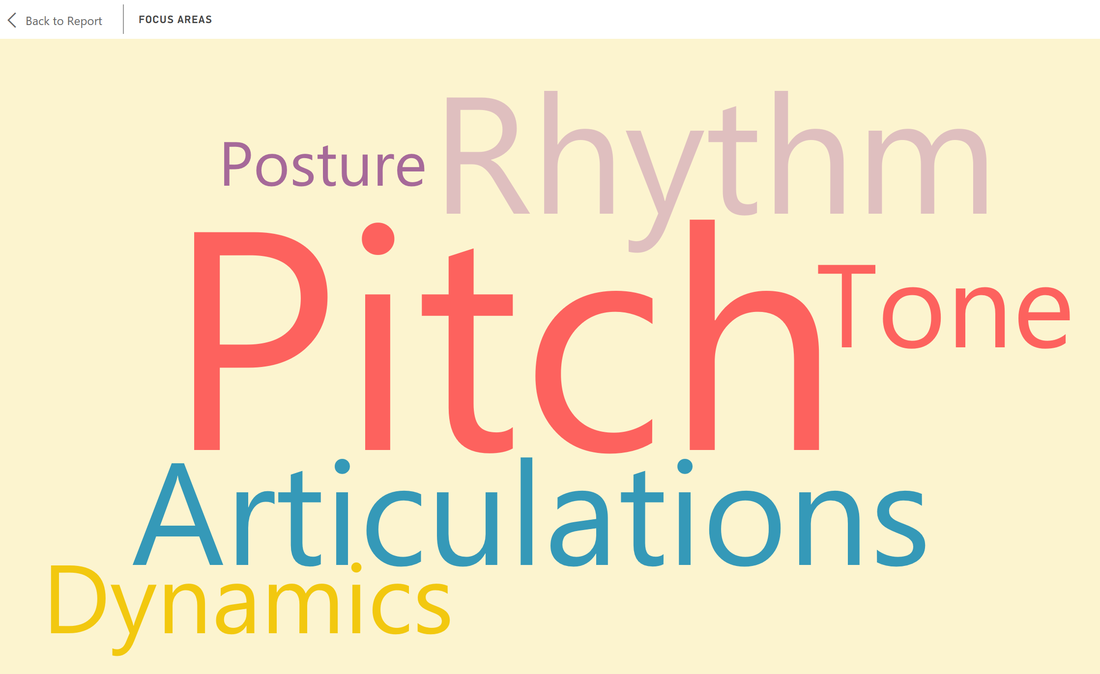
The One Rubric to Rule Them All

I like to use rubrics now since I jumped on the grading-for-mastery bandwagon. This takes more time rather than marking stuff correct/incorrect and coming up with a percentage. Speaking of time, grading my 240+ students takes about….forever. Usually I'm trying to get through grading their work so fast that I don't spend the time needed to keep track of the issues I'm seeing. There are other 3rd party rubric tools out there I could use, but nothing I've seen fits my rubric-ing style, so I made my own rubric scoring tool in PowerApps.
Picture
Student work example on left, rubric scoring on the right
​My rubric app adapts to the domain I'm grading. If I'm looking at my students' written work, I choose  "Writing" in my dropdown, and now all my mastery standards change on the apps' screen. Each standard also has a list/combo box picker of common issues I can select from as I'm grading their work. So, I look at my student's work, I move the slider to give them points for that standard, I select the issues I'm seeing, then hit save. Easy-Peasy. If I'm scoring a performance activity, I just switch the domain to "Performance" and my app adjusts all the mastery standards and coinciding issues to reflect it. All the data gets saved to me, I pump it into Power Bi for analysis, and I can export/import scores into my LMS.
Picture
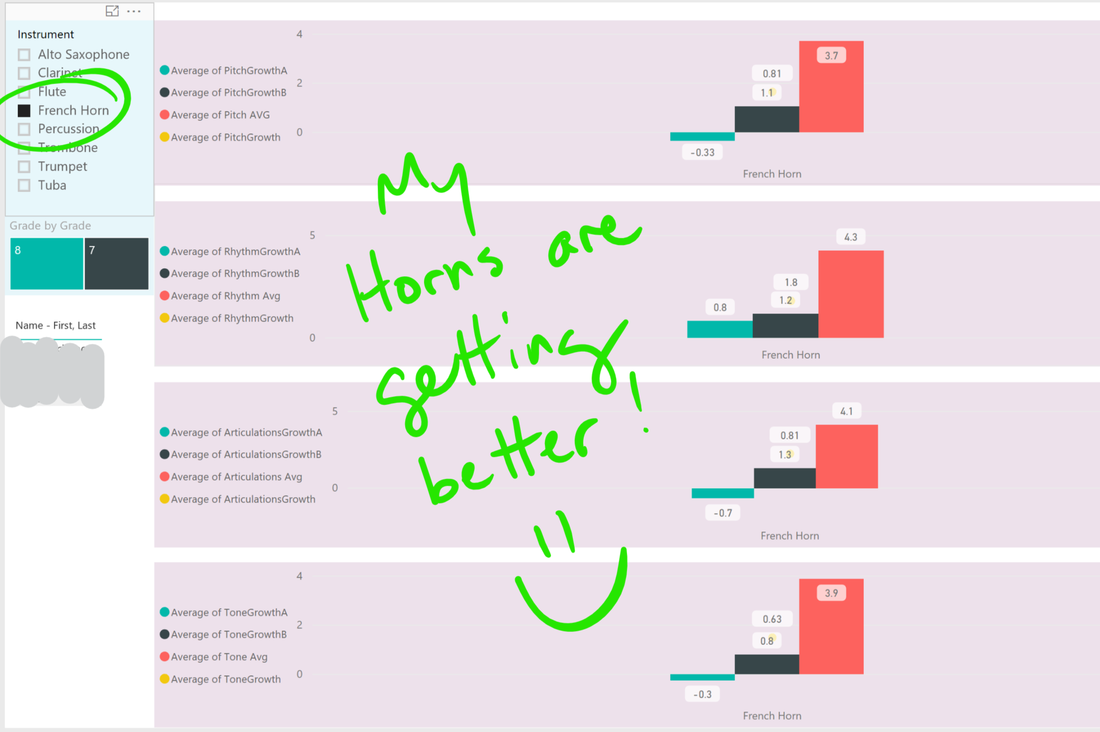
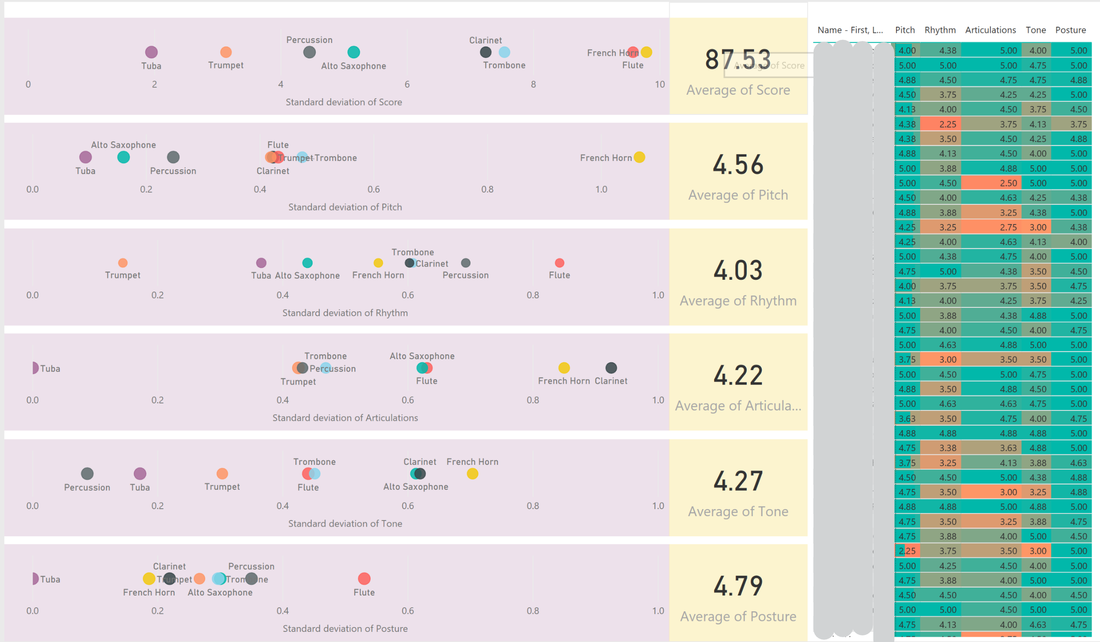
Mastery Rubric Scores are fed into Power Bi

#LessCodeMorePower

​I'm at the point now where I can build an app in a weekend to use during the next school week. It's really that easy, and the PowerApps team is working to make the learning curve easier all the time. Do a search on YouTube and you'll find all sorts of people in the PowerApps community making videos to teach and help you out. Follow the #PowerAddicts hashtag on twitter and you'll find a wonderful community of insightful people willing to lend their expertise. PowerApps has empowered me, allowing me to create the apps I need to work more efficiently, improve my pedagogy, and get more insight on my students' learning and progress. 
2 Comments

PowerApps, Power Bi, and Pedagogy

2/16/2019

3 Comments

 
Recently I was at the TCEA Educational Technology conference in Texas. I was there with the assistance of the MIE Expert program to present my  session on using Power Bi for student data analysis. This is my 5th time presenting this session; I've also presented the same topic at 2017 Fall CUE, 2018 NCCE, 2018 Spring CUE, and 2018 CETPA. Every time my session changes a little bit because the data has changed and I have more examples of actionable pedagogy based on the data. However, this time at TCEA there was a much bigger difference, and it wasn't related to me. I was one of 3 Power Bi sessions at this conference! Three! I'm used to being the only Power Bi anything at conferences I attend, so this was a pleasant surprise to see. I've been raising as much Power Bi awareness as I can for the past few years, and it seems like now we're moving into the early-adopter phase of this educational innovation. 
Picture
Why yes, I did go wireless during my session
I got to be honest though, as much as I love using Power Bi, PowerApps has recently been hogging my free-time attention. I've blogged about creating apps to help alleviate the complications of my classroom inventory management, but lately I've been developing for pedagogy. I teach a lot of music theory in my classes (by "a lot", I mean more than the typical middle school classroom). By the time my students head off to High School, my 8th graders can create Intervals, Triads, Scales, and can use all that knowledge to create polyphonic music using both relative Major and Minor scales. When it comes to teaching all this theory pedagogy, I have OneNote Class Notebook and StaffPad to create custom assessment exercises, or I can use other assessments I have from Finale or Alfred. This is good practice for my students, but it is A LOT of grading on my end.

Just the other day my students were working on an Interval worksheet (identification) with 24 different Intervals on the paper. I have 100 students completing this work, so that's 2,400 Intervals I have to grade for one assignment on one day. Sigh.... So, for a few hours at night I have to go through each worksheet, quickly scanning over them just to see if my students' identified each Interval correctly, the do the math and give them a grade. Alternatively, I could get a couple students to grade them for me (I don't do this 😉). Regardless, because in both instances I'm trying to quickly get through this tedious grading exercise, I probably don't spend enough time looking at my students' answers to do some analysis and find out WHY my students are getting wrong answers. Is it because they didn't count the lines and spaces of the music staff correctly, or did they miscount the half steps between the two notes? Are these careless mistakes, or is there a trend going on? Figuring that out takes even more time ☹. ​
Picture
These take forever to grade
But, now I have PowerApps 😁
 
Over winter break I started brainstorming in my head how I could create music theory activities in PowerApps, and not for stuff low on Bloom's totem pole like identification, I'm talking about creating. That's really what we want our students to do with the knowledge and skills we teach them. "I've taught you, now go prove you understand by creating something!" Working on previous PowerApps, I gained  some understanding of using variables which really helped out in the design process of the music theory activities. It also really helps  that music notation has a bunch of math going on based on note placement and value too. I could create an assessment activity where my students manipulate music notes, submit an answer, and I get to collect all the assessment data I want (because I'm the designer and I know what information I want from my students' answers 😉), and then dump all that data into Power Bi for automatic grading and analysis. Did you read that? Automatic grading and analysis. So I got to work, and within a few days I had my first assessment activity for my students.

​My first assessment related to what my 7th/8th grade students were currently learning back in January; creating Major and Minor scales given a tonic note and using the Half Step/Whole Step formula related to both modes. This activity reinforces their knowledge of Treble and Bass Clef notes, Half and Whole Steps, Enharmonics, basic Intervals, lays the groundwork for establishing a Key for a piece of music, and also helps to explain the whole reason for a Key Signature. Normally this is done through paper and pencil activities, and also takes forever to grade.
Picture
Creating Major/Minor Scales
Creating the app was fairly straight forward. Create a music staff, clef sign, and a whole note for my students to manipulate. PowerApps doesn’t support drag n drop, so I created a control for the first whole note. Using the control a student could raise/lower the note and add a sharp/flat/natural. When that was complete and ready to duplicate 7 more times, I realized my setup would be too excessive. Instead of having a control for each note, I wanted one control that could manipulate each of the 8 notes, depending on which one was selected. I used context variables to make this happen. After my 8 notes and control were set, I had to figure out the instructional design process of:

1) Teacher assigns scale
2) Student sees assigned scale, creates scale, and submits scale
3) Student no longer see assigned scale because it has been turned in.

To figure this out I used some knowledge I recently gained on creating star-schema data models. Each assigned scale would have a primary key in one data table, and on a separate table my students' submissions would include a primary key (created on their submission). If a match existed, that scale was "turned in" and wouldn't show up on the screen anymore. Cool stuff.
Picture
The app has been well received by my students
​I took a couple days to beta test the app/activity with my students and get feedback. They used their classroom iPads, running the app through the PowerApps mobile app or in the web browser. We discussed what worked, what didn't, and how could it be better? Overall the feedback was positive and I made some changes to the submission process to avoid accidental submissions by the students. The good news is since all my data was going into Power Bi, I could filter out those beta testing days so they wouldn't count towards the students' assessment score. Speaking of Power Bi, that was the last step in this process. Now that my student answer data was coming in, I needed to create my algorithms to get the insight I wanted and organize the data in a meaningful way for my students and me.
Picture
Didn't grade a single one. Power Bi did.
​Numbers don't lie, and that's what we saw. Some students had trouble with their clef signs, some were struggling with the basic ascending intervals of the notes, and others weren't counting their Half Steps between the notes correctly. When students saw this information in Power Bi on their end, they were able to filter out their answers to see how they were doing and what mistakes they were making. We had some good conversations in class reviewing the knowledge and skills they needed to successfully complete the scale creation activity, and as the data shows, they've gotten better over time. And yes, creating this whole setup took hours, hours that I could've spent grading paper and pencil worksheets, but now that I've got a super time-saving resource that challenges my students' learning, automatically grades, gives us the insight we need, eliminates photocopies, and I can reuse it now whenever I want.
Picture
My 4th gen iPads are still little workhorses
​It hasn't ended too. This past week my students used my new music theory PowerApp to complete another activity, creating Intervals. Not basic ones, but Major, Minor, and Perfect Intervals. For this activity, I didn't want my students to be working on the same Interval at the same time because we sit close to each other and they have wandering eyes. Using a timer control and the Rand() function a few times, I created an algorithm that would create 10 random intervals for my students to complete. My students navigate to the correct screen, hit the button, and now have 10 Intervals to create that don't match anyone else in the classroom. The intervals differ in Clef Sign, Direction, Root Note, Accidental, and Interval. Students' answers get dumped into Power Bi, and now we can see more than just if they got it right/wrong, but what mistakes did they make to get it wrong. Once again, cool stuff.
Picture
Assessment #2! Creating 10 randomly generated Intervals
Picture
Sometimes you need a reference
Picture
Creating Intervals Power Bi data. I'm gonna need to spend some time revisiting this skill
​So far my students have submitted 723 scales and 1367 Intervals that I didn't have to hand grade. They're better at Scales than Intervals, and I know which students I need to revisit concepts with so they can successfully create these digital music theory artifacts. Future steps include a Creating Major/Minor Triads screen, and a Creating Treble/Bass Clef notes screen for my beginner students. I also need to create a method for my students to track their music theory mastery based on the numbers they're getting in Power Bi. This is related to Sonny Magana's T3 framework, and will probably involve my students using Excel 😁. In some good news I also just figured out (finally!) how to create a Report Tooltip in Power Bi, so my students can get the personalized (and anonymous) data about their progress faster.
Picture
So glad I finally figured out how to create a Report Tooltip in Power Bi
​I think I have a new EdTech conference session I need to start submitting during the proposal process: PowerApps, Power Bi, and Pedagogy
3 Comments

Data-Driven Interventions in the Music Classroom Part 4: Slow Cook'n a Data-Driven Iron Chef

9/10/2018

1 Comment

 
This is part 4 of a series of posts I'm writing on my past school year using various edtech tools for data-driven interventions.
Picture
I first learned about the Iron Chef activity from Jon Corippo. You put kids together in a group, give them a topic to research, and then give them twenty minutes to throw together a slide deck before they get up and present. It's a fun activity, but my students and I weren't ready to do this whole process in one or two class periods. This whole time I was slow cook'n the process, getting them ready for their collaborate group project.​
At this point I had placed my students into groups based on their neediest/lowest performance category (Pitch, Rhythm, Articulations, and Tone). Their next assignment was to collaboratively work together to put together a PowerPoint slide deck that generally focused on:
  • Their instrument(s)
  • Their performance technique category, such as:
    • How do you achieve this technique on your particular instrument?
    • Common mistakes
    • Good habits​
​Assignment details were located and distributed through OneNote, however this time I created a specific collaboration section for each group in the Collaboration Space of the Class Notebook and distributed each specific group page there. That way the groups had access and could collaborate together on their assignment page, but couldn't mess around with any other groups.
Picture
​Regarding the slide deck file, normally in an Iron Chef activity one kid in the group creates the file and then shares it to their colleagues and the teacher, but I didn't want to do this. My students didn't have enough practice with that particular skill and I wanted to avoid any hiccups related to it. In a perfect world/classroom I would have been able to create this assignment in Microsoft Teams, attach the PowerPoint template file I had created for each category group, and assign it to the group members thereby taking care of all the cloud/file permission stuff. Alas, my district still hasn't turned on Teams for the students yet ☹, so I took the matter into my own hands. In my OneDrive I created a folder for the project slide decks and created a template PowerPoint file. Basically I just put some directions on the first slide. I then just copypasta'd the file until I had enough for each group, and changed the title of each file to reflect Group 1, Group 2, etc. I then created a sharing link with editing rights for each file and copypasta'd that onto the corresponding OneNote group assignment page. This way my students could click on the link to get to the PowerPoint file in the browser, then click on the "Open in PowerPoint" button to open up the file in the iPad PowerPoint app.
Picture
Collaborating in PowerPoint on iPads
After that my differentiated collaborative group project was ready to go. For this project I gave them a couple weeks to get it done, and I gave them more class time to sit in their groups and work together. A few students were already behind on their previous assignments, and quickly realized how much they immediately needed to catch up. I also experienced seeing some previously-unknown leadership skills being used by students that usually are content sitting in the back of their instrument section and playing just enough to get by. That was cool.
PictureWorking in groups. Can you tell I'm enjoying the Paint 3D app?
​

Picture
Feedback
 
Fast forward a couple weeks. Instead of having each group get up and present in front of the class. I assigned the students to peer assess three of the other groups' slide decks. In order to get this done I needed to give the students viewing access to all the other groups' slide decks, and keep everything organized so there wouldn't be any tech hiccups. I first created a copy of each group's PowerPoint file and saved them in another folder in my OneDrive. I didn't want any last-minute-way-past-the-deadline-and-we-didn't-finish editing being done during the peer assessment process. I then navigated to the <iframe> embed code for each file and copypasta'd it into a separate Sway. I used Sway so I could also embed the Peer Assessment Form and the directions and keep everything centralized. Then I took all the viewing links to each Sway and put them in OneNote. I created a table so each student could find their group and then click on the corresponding link to get to the other group's  Sway project page. When the OneNote page, the Sways, and all the links were ready the students came in one day and started peer assessing their classmates' collaborative work. Their peer assessment scores were inputted into a Form, which of course I then uploaded into Power Bi so I could create a feedback chart to give back to the students afterwards.
Picture
Picture
​This whole slow cook'n process took over a month. It was during #EdTech conference season, so my traveling to various conferences definitely slowed down the flow. Plus I was doing this for the first time, so I was creating all these new OneNote pages, Sways, Forms, PowerPoint files, and Power Bi charts as we went along. We also weren't working on this everyday. We were rehearsing, practicing, doing our theory, and other various classroom activities throughout the weeks. In the end my students had completed some data analysis, reflected on it, did research on how to become better at their particular performance technique deficiency that corresponded to their instrument, then collaboratively worked together to synthesize that info and create a slide deck that presented the relevant information. I enjoyed brainstorming and designing the process, and I enjoyed seeing their work. Most importantly my students were practicing the 21st Century skills they will need when they get into high school.
We still weren't done yet though. My students had reflected and researched on what they needed to improve upon, next they would have to put it into practice...
1 Comment

Data-Driven Interventions in the Music Classroom Part 3: Data Analysis & Reflection

8/17/2018

0 Comments

 
This is part 3 of a series of posts I'm writing on my past school year using various edtech tools for data-driven interventions.
Picture
Note: About midway through the school year, I decided to continue the next phase of this process with only one of my two advanced 7th/8th grade classes. Flipgrid assessments continued for both classes, but for various reasons I only continued the data-driven intervention activities with my band students.
Usually after Winter break, I spend time with my 7th/8th grade advanced students teaching them new music theory concepts, new performance techniques, new rhythms, etc. Along with the usual January lessons, it was time to act upon the performance assessment data I had been collecting and sharing back through Power Bi. In the previous school year I did a practice run of this kind of activity. Students did some analysis and wrote a reflective essay (gotta support that ELA CC!). However, this time around I decided to keep the reflection part, ditch the essay, and integrate more actionable activities for the students. Here is how we started.
Student Reflection on the Data

I created a reflection activity for my students. Basically just asking them a bunch of questions about what they saw in their personal data from the class Power Bi report. The goal was to incorporate math skills (chart/visual analysis, finding averages, comparisons), have them write using music academic vocabulary, citing primary sources, and of course some critical thinking, communication, and metacognition. The assignment was created and distributed in our OneNote Class Notebooks. During the design process for this activity, I used tables and colors to visually organize the areas where students would enter in their answers, and I embedded the Power Bi report right onto the page because that's how awesome OneNote and Office 365 can be. After the page was ready I distributed it out through the Class Notebook tools tab. Students were given a week to complete the assignment before I would start leaving feedback. On the first day I directed them to the assignment, explained it, answered questions, got them started, and then flipped my switch to facilitator mode for the rest of the class. For the rest of the week sometimes I would give them a little time at the end of class after we finished doing our daily music education stuff. Because of the awesomeness of Surface, OneNote, and digital ink, I was able to review and leave feedback late at night before bedtime. Some students got their math wrong, or didn't even understand what kind of math was required to find their average. Yikes(!), but whatever, I'm a teacher and this presented a teachable moment. Some of the questions at the bottom of the assignment that required critical thinking were challenging for the students, but I helped them out in person or with my OneNote feedback. Students were also allowed to revise and improve their work as much as they needed to.
Picture
Example of one of my student's reflection on the data. This was a really good one.
How do I improve?

After I was satisfied with their data analysis and reflection work, we moved onto the next step. Based on the numbers, what was their neediest performance technique? Was it Pitch, Rhythm, Articulations, or Tone? (Posture was excluded)
Picture
Same student as above
For this assignment they had to get online and do some research, looking for resources on how they could improve their particular performance technique for their instrument.  Note: Technically they had two separate neediest categories they were aware of, one from their peers and one from me. For this assignment they used their lowest scoring category according to my scores. I asked for a minimum of two sources (one video, one written), and they had to explain their value and cite where they were from. I left room for four sources and a lot of my students filled those up. Want to know another great feature of OneNote? When students posted the link to a YouTube video on their OneNote assignment page, the video automatically embeds itself. I was able to watch their source videos without ever leaving their assignment page 😊. I gave them a week to get this done.
 
Meanwhile...

Now, while they were busy getting their research done, I was doing a little organization on my end for the next phase in this process. In my non-public Power Bi file I created a table that displayed my students, their average performance scores (from me), with a little conditional formatting thrown in. Looking at this table I started jotting down my students names in OneNote, organizing them into groups based on their lowest/neediest performance category. I kept the groups to 4-5 students, and I mixed up the instrumentation as best I could. I kept my percussion kids together in a group, since their performance technique differs from the wind players, and I also tweaked the groups a little bit based on student behavior, separating my chatterboxes.
Picture
Check out those Tuba scores □
I ended up with 11 groups; one for Pitch, three for Rhythm, four for Articulations, and three for Tone. As my students were reflecting and researching, I had begun slow cook'n an Iron Chef activity for them, and soon we were about to dig in.
Part 4 begins the intervention phase of this whole big process, and is coming up next. Stay tuned as I present my experience of slow cooking an Iron Chef activity with my band students. 
0 Comments

Data-Driven Interventions in the Music Classroom Part 2.5: Data everything with Power Bi

7/30/2018

0 Comments

 
This is part 2.5 of a series of posts I'm writing on my past school year using various edtech tools for data-driven interventions
Picture
,After my students completed their first round of Flipgrid recordings and peer assessments, I had rows of data in my Form/Excel files stored in my OneDrive. Now it was time to set up my Power Bi report that I would share back to my students. For this project I was using the Power Bi Desktop application, and for several reasons:

  • I could import multiple data tables from various Excel spreadsheets into one Power Bi file.
  • Creating relationships between data tables in Power Bi is super easy.
  • The desktop app includes a Query Editor. This means I could make the changes to the data I needed to make without changing the original data stored in the Excel files.
  • I gave me the ability to hide table columns that have identifiable information like my student's name, SID, and email address. People wouldn't be able to  see that information if they selected "See Records" in a chart.
  • I could create new columns in a data set and write formulas for them.
  • It included some visual formatting tools I wanted access to, like "Send Backward"
Picture
These desktop app tools are important to me
There are a couple methods of getting and installing Power Bi on your PC, but if you have a Windows 10 machine, I recommend getting it from the Microsoft Store. That way you'll automatically receive updates and won't have to do any monthly manual updating yourself.
 
My Power Bi file lived locally on my Surface Book in my work OneDrive in the same folder as my Form/Excel assessment files. I did this to help me keep my stuff organized, but it turns out keeping a Power Bi file in my work OneDrive space allowed some automatic data updating to happen in the background. More on that in a bit.
 
Once I was in my Power Bi file, I queried my assessment data using the Get Data button and selecting my Form/Excel files. After bringing the data tables into the application I had to do a few things to get my visuals to look the way I wanted them to look.
Picture
Creating new columns
I had rubric scores for performance categories, but I also needed the scores added up (maximum 25 possible) in a separate column to get a Total, and then multiple that number by 4 to get a Score in another column. In the past I would have done this in Excel, but now I can leave the original data tables alone in their Excel file and do all my edits in Power Bi. I clicked the New Column button, wrote my formula for that column, and voilà! Done.
Picture
Creating relationships
Since I was using alias codenames on my shared report. I had to connect my Peer Assessment data table (that have my students' names) to my Alias table (also has students' names) by creating a relationship between them. From the Relationships view in Power Bi, I found which columns have the same values, and it's as easy as clicking on one column and dragging the now visible line to the other column. SOOOOO much easier than Excel.
Picture
Edit the data without messing up the original set
My students did a big Fall chair test assessment. Every student performs in the class and receives a peer assessment from every present student in the room (around 50). I created a new peer assessment form for this, because I was asking some new questions, but now a I had two separate sets of peer assessment data. My Flipgrid assessments and my chair test assessments. I needed these data sets together, so I could keep all that data in the same visual and keep it linear. Thankfully, Power Bi is awesome and can do that. I opened the Query Editor and used the Append button to combine the two tables into one. I had to do some editing of the original column names, so the program would see the match, and silly me also forgot to give the chair test assignment title a number at the beginning. No problem, I just did a find/replace, changing "Honor Band Audition" to "3 - Honor Band Audition". Now my data visual wouldn't lose the progressing linear awesomeness I had created.
Picture
Append separate tables together
Picture
Combining tables together to keep everything together
Picture
Doh! had to replace a value
Picture
New question, new issue to figure out
This was a new peer assessment question for the Fall chair test. Students would choose two, and then I wanted to show the frequency of the chosen options in a word cloud. It worked, but I had to take some steps to clean up the data. The original answer data would format both student-selected options as "option;option;". For my word cloud to work, I needed to get rid of the semi-colons and keep a space between the words. I made this work in the Query Editor. I duplicated the column, and then used the Extract button to get rid of the semi-colons and add my space. Now my word cloud was set ?
Picture
Extracting the semi-colons to get rid of them
Picture
Got my word cloud working!
Picture
Creating my assessment scores visual
At this point everything worked perfectly as I created my visuals. I really like the visual editor in Power Bi, and every update (about once a month) it gets more intuitive and also gets new features. It's really just dragging and dropping table columns onto a canvas, choosing the right visual, and then making it look visually appealing and intuitive for students. My assessment report page included both the Peer Assessments and Teacher Assessments, comments, focus areas, instrument checkouts (from another data source/point I was collecting), and slicers so my students could filter their data out and compare it to their grade level(s) and section(s).
Picture
Picture
When I was happy with what I created, I clicked the publish button in the desktop app. This process would take my report file and send it to my Power Bi space in my Office 365 account. After visiting the published report in the browser, I "published it to the web" which created a public link that I could share with my students. All my data had been anonymized and hidden, and you better believe I constantly checked on this throughout the year. Pasting the link on a page in our OneNote Class Notebook automatically embedded the webpage/report on the OneNote page, which made it visually super easy for my students to find and load up.

Picture
The report pops right up in OneNote
Because I chose the "Publish" button on the desktop app to send my finished report up into the cloud, I still had to manually update the report as assessment data was coming in. I had a couple options for this:

  • I could open up the Power Bi report file, click refresh, let it pull in all the new data from the Form/Excel files, then hit Publish and send the updated report back into the cloud.
  • I could install and use the Power Bi Personal Gateway application onto my computer. This program would let me create scheduled times where the Gateway app would do all the updating/syncing process in the background on my Surface and also let me start the process manually in the web.
 
I chose the latter but did run into some network firewall issues on my district Wi-Fi where the Gateway app couldn't connect to the internet. So when I wanted to update the report, I would hop over to my personal hotspot, run the update, then hop back over to my district Wi-Fi.
Picture
Manually refreshing the data sets connected through the Gateway app
Something I didn't realize I could do at the time was start the publishing process from Power Bi in the web. Here it is:

  • Use Power Bi desktop to create my report. Save my file to my OneDrive.
  • Go to Power Bi in the web, hit the "Get Data" button, and find the Power Bi report file. Upload it to Power Bi.
  • The report is published to my workspace, just like the other method.

The benefit of this method is that it allows for automatic hourly updates without needing the Gateway app, but I'm not exactly sure it can connect to my data sources to pull in new data. I have to test this out. If it works, it'll be my new process.
Picture
A view from my personal report file
Throughout the school year I added more and more assessment data to the report file. I designed a cool string intonation activity with my string kids, we did music theory assessments, instrument checkouts, and ELA stuff too. I also had another Power Bi report file running at the same time that was only for me to see. In this separate report I could see student names, create quick charts, and mess around with my data to see if I could get more information out of it, like how do my student's peer assessment scores for Johnny's Flipgrid recording compare to my assessment scores for the same recording? After I find those differences, is there a student whose scores are constantly irregular? If so, what does it mean, and what do I do? Interesting stuff. My personal report file was also my testing ground for writing my column formulas that I would use in the public student report.
Picture
Looking at standard deviations of listening scores because why not?
My public student report can be seen below. This is what was shared with my students. Performance assessment data is on pages 4 and 6.
Putting this together was a learning experience. I would run into roadblocks as I added more and more data to the report, and I would get stumped from time to time writing the algorithms I needed. I found help by reading/lurking the Power Bi community forums for answers, and the more I practiced, the better I got. When this upcoming school year begins, I'll already have a working system with working algorithms in place.
 
This was only a step in the whole data intervention process though. Now that the data was mapped out, what would the students and I do with it? That part will be up next ?
0 Comments

Data-Driven Interventions in the Music classroom Part 2: Designing my Data Workflow

7/19/2018

26 Comments

 
This is part 2 of a series of posts I'm writing on my past school year using various edtech tools for data-driven interventions.
Picture
This past school year I took a classroom routine and translated it (I'm currently reading Sonny Magana's T3 book 😉) by integrating Flipgrid and OneNote into the process. This allowed for an increased frequency of student performance submissions, along with the resulting assessment scores from class peers and myself. I was pulling in lots of data. Rubric scores from students and myself, and plenty of feedback comments. The goal was to effectively use this data to help drive instruction and interventions with my students. Based on my previous experience messing around with and sharing student data, I had ideas for what I wanted going into this project:
  • I wanted my students to have access to this data
  • I wanted the data to reflect their progress/growth over time
  • I wanted my students to be have the ability to compare their progress with their instrument section peers and their grade level peers
  • I wanted to tie in other data sets I already had access to, was currently collecting, or was planning to collect in the future
  • I wanted to be able to use the data as a catalyst for future intervention activities with my students
While I was brainstorming how I would get all the pieces in place to make this work, I had ideas regarding my data organization and management setup:
  • I wanted to minimize the amount of data files I was collecting and querying.
  • I wanted my data model setup to be as much hands off as possible. In other words, I wanted my setup to include as much automation as possible, reducing the need for me to manually refresh queries myself.
  • I wanted to design my own data presentation. I was creating a digital artifact that would be shared back to my students, so I wanted control over how it would look.
  • Students would need simple access to the finished product
Picture
Students were able to select their alias name to filter through the data and see their own stats
For this project I used my go-to data tools I've been messing around with for a few years, Excel and Power Bi. Both are a part of the Office 365 suite, and can connect and talk to each other through OneDrive making the this whole process a lot easier. Excel files are where all my data sets would live, saved into a folder in my OneDrive. Power Bi was used for two different reasons. Data organization and presentation. It brings all the different sets of data together, organizes them, connects them to each other, and allows  me to write my own algorithms to get the numbers I'm looking for. At the same time, it provides the canvas and tools for me to design a data visual report that can be shared back to my students. Creating the workflow I wanted required some technology knowledge (TK!) on the different ways the software programs could communicate with each other. I worked my way backward, starting with Power Bi.
Picture
Hiding sensitive information
There are two methods for organizing and creating a Power Bi report. Through the web browser or through the desktop application. Well, last August when I was planning all this I ran into an issue. In order for students to have access to the resulting Power Bi report, the report would have to be shared publicly on the web. That just screams FERPA violation, so I needed a way to anonymize the data and hide any student identifiable information. At the time I was beginning to experiment with the desktop application because it has more bells and whistles for organization and design, and I found my solution from within the program. It was actually pretty simple. Just right click on the specific column of data and select "Hide". That hides any information in that specific column from being seen when people select the "See Records" function in a Power Bi report. I couldn't do that in the web browser version, so now I was going to use the desktop app regardless.
Since I was now using the desktop Power Bi application, and I planned on connecting to Excel files (where the performance assessment data was going to be stored), the Excel files had to be local on my computer. I needed a way to get the data localized, but at the same time I wanted to minimize as much querying as possible. I wanted some automatic data syncing to happen in the background. I figured out how to get that done by using Office Forms. Like any other Form tool, the data submitted through the Form could be exported and associated with an Excel spreadsheet file. However, last summer I found out that after I saved a Form's corresponding Excel file locally to my computer, the connection between the Form and Excel file was severed. New Form responses would not propagate to the Excel file. I found a solution to this, and you can read about it here. By creating a Form from within OneDrive (instead of the Forms tile in the Office 365 waffle), I would get an Office Form/Excel file combo that would continuously sync responses to a localized file on my computer. Now I have one less query for me to do myself 🙂
Picture
I created one Office Form for each set of assessment data set per class (Band or Orchestra). One for me to use, and one for my students to use. I did this so I could later do some comparisons between the two data sets in Power Bi. I screen clipped pics of the peer assessment rubric I had previously created, and dumped them into my Office Form. Each rubric category (Pitch, Rhythm, Articulations/Bowings, Tone, Posture) was a multiple choice question in my Form. The choices were 1, 1.5, 2, 2.5, etc. all the way to 5. I also had a comments question too, but because of the way the data would be shared with my students, the comments couldn't include any identifiable information. I had a talk with my students about not inputting any identifiable information such as name, gender, grade, and even a mention of the performer's  instrument. It worked, and if a student did accidently type in some identifiable information, they let me know and I was able to delete the string of text from the data set (in the Excel workbook).
I needed a way to get Power Bi to see relationships between my two assessment data sets, so I had to make sure the resulting data tables had columns with the same values. One of the questions I included was "Who are you assessing". This was a multiple choice question with 50 answers, one for every student. When I created this list of student-name answers, I had to make sure each string of text matched the same string of text in the Office 365 directory (when a student fills out the assessment form, the Form captures their name through login credentials and inputs it into the Forms spreadsheet). Apparently at my school hyphenated last names are a growing trend (please stop!), and that can interfere with text string relationships if they don't match. So, if my student's name is "Johnny Bravo-Charlie" in the Office 365 directory, then in my "Who are you assessing" question the Johnny option has to match that same text string. I found this out the hard way 🙃
Another question on my Forms was "which video performance are you assessing?" Another multiple choice question, its choices were the exercises the students were performing and recording into Flipgrid. Every time a new performance assessment was assigned to my students, I would just go back to the Form editor and edited the question to include the new assessment option. I wanted the data from these different performance assessments to appear linearly in a data visual, so in front of the title of the assessment exercise I put a number. "1" for the first assessment, "2" for the next one, and so on. This way Power Bi would easily recognize the order I want the assessments to be in. Every once in a while a student would choose the wrong exercise title in their peer assessment submission, but I was able to find the entry in the Excel file and edit the response to include the correct value.
Picture
Using this setup I had two sets of data per class that would automatically sync into Excel files saved in my OneDrive. I connected/queried these data tables into my Power Bi desktop file, and started creating my visuals as the data began to flow in. When I was happy with it, I published the report to my Office 365 workspace to make it official. To share it with students, I needed to go to Power Bi in web, find my report and open it up, then select the File-->Publish to Web option to get my sharing link. Sharing it with the students was simple. I could paste the link anywhere in our OneNote Class Notebook and the report would automatically pop up on the page, creating easy access (visually) for my students. Now my students could get the feedback from their peers and me on their performance assessments.
Picture
My data collection workflow
It was a bit of work to get this whole system set up, but the best part was after it was done in the beginning of September, my students and I were ready to use for the entire school year. I was able to add more data sets into the report over time (which I did), but my performance/peer assessment workflow was set in place and ready to use. 
Part 2 will continue in my next post, where I'll discuss how I used Power Bi to manage all this data. 
26 Comments

Data-Driven Interventions in the Music classroom Part 1: Flipgrid FTW!

7/7/2018

1 Comment

 
This is part 1 of a series of posts I'm writing on my past school year using various edtech tools for data-driven interventions.
Picture
Capturing students' performance skills on their instrument is an important measurement for music teachers. When I observe a student perform, I can hear and see what they're doing well, and what they are struggling with. Their challenges can either be related to reading and interpreting music notation, or the kinesthetic aspect of playing their instrument. Playing with correct articulations, posture, bowings, and the minute details of their finger technique are all important to successfully performing on a musical instrument. As important as this is in music education, it is a time-consuming process to hear every student in an ensemble. This past school year my average class size hovered around 50 students. Unlike a written test, where students take an assessment at the same time, I have to listen to each student individually. Listening to each student perform an assessment during class takes at least 3 to 4 days, and can easily eat up a week of class instruction. It is important though, as it starts teaching my middle school students some practical life skills like responsibility, communication with their parents to schedule practice times in my classroom, how to deal with the anxiety of performing in front of peers, trying your best, and the idea of Practice makes Perfect.
Over the past decade or so, technology has been introduced to alleviate the time management challenge of listening to students individually. Using stationary video cameras to record students, sending/receiving video recordings though communication services like email, LMS, or the cloud, well designed (but expensive ☹) solutions like SmartMusic, and even submitting recordings directly through OneNote. All of these could work, but in their own little way were never the best solution for me. Then along came Flipgrid, and I found a tool that worked perfectly for my student performance assessments
Picture
Flipgrid took care of a lot of little issues I had with other technologies. It records video, providing me with both the audio and visual I want. It hosts and organizes the videos seamlessly, which at the time was such a huge feature for me. Teaching students how to record, save, and send a big video file (which is always dependent on their device and the communication service) is no longer a cumbersome task for the students and me, and I don't have to worry about saving and syncing a large amount of video files to the cloud and my computer. With Flipgrid, it's a breeze for my students to submit videos of themselves performing, and it's a breeze for me to access them. That was such a game changer. Flipgrid also makes the process fun for the students, giving them the ability to add graphics, digital ink, and all the buttons my students can click on to like each other’s videos. I'm not fun like that, just ask my students. Most importantly though, the listening-to-students-perform assessment process was moving out of my classroom instructional time. Student could now perform and submit their assessments videos before or after school in my room, or at home. 

Picture
First assignment using Flipgrid: Describe your instrument!
An intro video for one of my assignments
As I've written in previous blog posts, I incorporate peer assessment into my student performance assessment activities. I assess my students when they perform, and the students do too. We use a rubric and a form. It started out as a paper/pencil routine, but I've since moved the process to using an Office Form. It's more practical, and I get so much relevant data now from my students! This year had to be a little different though, because I was adopting Flipgrid into the workflow. Now I'm able to assign more assessments, but I can't have students still assessing the rest of the whole class (50 students!) using my assessment form. They would go nuts and hate me. I narrowed it down to three. Every time my students had a new performance assessment to submit though Flipgrid, they would only have to do three peer assessments.
Picture
Picture
A Flipgrid assignment page in our OneNote Class Notebooks
We use OneNote Class Notebooks, so organizing all the little parts of this activity was easy. Instead of sending my students off to various parts of the web to get the info they need, I bring it to them through OneNote. At the top of my OneNote assignment page were all the instructions, followed by the embedded Flipgrid topic for easy access. After that I included a graphic of the percussion music for the wind players. The percussion kids' music was different from the wind players, so the wind players assessing them needed to see the music they're assessing them on. Below that I embedded the Office Form the students would fill out for their peer assessments. I used the same Office Form for the entire school year, which I will explain later in another blog post. My students needed to know who they had to peer assess, so at the bottom of the OneNote page was a table for students to find their name and the other students whose Flipgrid videos they were assigned to assess. Setting up the table was easy using Excel. I downloaded my class roster into Excel and copy/pasted the list a few times moving students up and down each time there was a new assessment, copy/pasted the finished table into OneNote, and then gave it a splash of color. In the end, I had an assignment page with all the resources my students needed. This eliminated a lot of those "how do I…" and "where do I…" questions from my students.
I would drop hints to my students as to what their next assessment exercise would be (usually from our method book) during class, but when the hammer officially dropped, I gave them a full week to submit their Flipgrid recording. Flipgrid can automatically close topic submissions, and I started using that method. I opened submissions again for the students that missed the deadline. Not a problem, they'll just lose a couple points. Speaking of points and grading, these were 10-point assignments. You either submitted your video on time (10 points), late (8 points), didn't submit at all (0 Points). That was it. I was using a point-based rubric to assess and score their performance, but that number never made it into the gradebook because I never intended it to. Those numbers was for something later 😉 Same deal for their peer assessment submissions. Ten points for 3 peer assessments, and then losing some points for each assessment not submitted. This took a lot of the anxiety my students have off of the performance aspect of the assignment. My students just had to submit their video and do 3 peer assessments to get full credit. Easy peasy.
Picture
Students hanging out and practicing for Flipgrid assignments. Clarification: The boy holding the violin incorrectly plays the trombone
It worked, and it worked really well. I was able to listen, watch, and assess my students more frequently throughout the year, and was able to space the assessments in-between concerts, concert rehearsals, semester projects, and honor ensemble activities. My students were checking out their instruments more to practice, and the couple days before a video recording was due my room was so packed with students practicing/submitting, they overflowed outside the classroom. As a music teacher, it was a incredible sight to see and experience 🙂 The students were engaged with their peers, helping each other with their music, showing lots of encouragement, holding each other accountable for their submissions, and pressing all those like buttons in Flipgrid. I even had a former cello student (now in high school) sneak his way onto the Orchestra grid and submit his own videos. That is just plain awesome. Who wouldn't love that happening.

A former student sneaked his way onto a grid topic and decided to add his own embellishments to the exercise 😁

Posted with his permission
Transforming this assessment routine with Flipgrid was just one part of the bigger picture. By doing these activities I was now receiving lots of assessment data from my students and myself. Data that could be used to track growth and progress, but also to find more interesting insights by comparing assessment scores between teacher/student, instrument sections, grade levels, before/after interventions, and more. How I was able to organize, manage, analyze, and share that data will in the next part of this series.
1 Comment

Data-Driven Interventions in the Music Classroom

7/6/2018

1 Comment

 
For a few years now I've been messing around with Power Bi, using it more and more with my students and myself as I learned how to use the program.  This year I integrated it even more into my pedagogy with my two advanced classes, made up of 7th and 8th grade students, to track their performance skills and more as it turned out. This past school year I've travelled to several Educational Technology conferences presenting on this recent work, and I get a lot of questions like "how I created and made everything work" and "how I came up with the idea." It's a long story, and is based on the edtech I use and more importantly music education pedagogy. It can't be explained in a single blog post, so my plan is to write a series of blog posts that covers what I've done.
Picture
Now, if you're looking at the graphic you're probably thinking this is nothing new, I do this workflow all the time in my classroom. Probably using some form of Formative Assessment. Good! You should be! My story will cover how I integrated the above set of technology tools to create activities that incorporate the 4Cs, student centered learning, a little bit of metacognition, data, and probably some more Edu buzz words.

The activities I'll be writing about spanned the course of this past school year. In fact, in my opinion I didn't even really finish the whole process. However, I feel it was a pretty good first run that can be expanded upon next school year. The cool thing is some of this data will carry over to next year, since I'll be seeing my 7th graders return as 8th grade members of my ensembles.

Stick around for Part 1
1 Comment

Some reflections on Student Data

2/22/2018

0 Comments

 
Last week I attended my first out-of-state Ed Tech conference, NCCE in Seattle, where I presented a session on using Power Bi. This was my first time in Seattle, and even though it was a short two-day trip, I really enjoyed the city and the conference. I was able to meet up with some MIE colleagues that I hadn't seen in a few years and meet some new faces too.
This is the second time I've presented on Power Bi at a conference, and it still isn't any easier. Trying to explain what I do, how I do it, and why I do it in just 50 minutes to an audience that may not have any experience using a spreadsheet is a big challenge. I think what I'm doing is the coolest thing ever right now, but I get a sense that it can be a little overwhelming. Since this was my second go-around, I tweaked the session a little bit by eliminating the Excel demo. I've been using Power Bi for two years now, learning on my own, and there really is just too much info that can't be packed into a one-hour session. I try to keep all the info as relevant as possible; I provide examples of the data I'm tracking, how my data models are designed, basic workflows I use, and the ins and outs of sharing Bi reports with colleagues and students. The most important aspect is the "So What, Now What?", which I'm still in the process of learning myself. Learning everything I know about Power Bi, data management, and design has taken quite a while, but it's pointless if I'm not using it for its purpose; steering my curriculum and instruction into the right direction for my students.
I get a sense this is potentially important in the future for teachers. Now that I have access to all this information and insight I never had before about my students' learning, how do I properly use this information to my advantage with my instruction and classroom activities? I see this happening already, but it’s not the teachers making the adjustments, it's software doing the job instead. I see the value in using software to guide students with their work and learning, but I still think I can do a better job of explaining content, concepts, skills, and ideas to my students based on their individual needs. So how do I do this? I teach over 230 students a day. I have multiple sets of data now about their understanding of concepts, their abilities, their strengths, and their weaknesses. I now have an opportunity to specifically target my students' learning needs. So, how do I?
This is what I'm experiencing now. As Toni Townes-Whitley, the opening NCCE keynote speaker said in her keynote, "How do I digest this data?", and as I'm learning right now, how do I correctly act upon it? From my experience this year, it requires time. Time to think. Time to analyze the data charts, filter through the various subsets, and find the important insights hidden inside. I must make time to do this, and for me it needs to be as distraction free as possible. Not only do I need to do my analysis, but I need to capture those spontaneous ideas of how I can act upon what I now know about my students' learning and abilities. This is the second half of the challenge, the "Now What?". With the information I now know through my Power Bi data, I'm generating all sorts of ideas on how I'm going to target my students' needs. It's a lot though. In my head I'm rearranging seating charts, even considering mixing up my instrument sections so I have particular sets of students sitting next to each other. This isn't normal. In the music room, the instruments all sit together in their sections, but now I'm thinking of throwing that idea out the window. Other ideas include collaborative discussion activities, new instructional activities, just new…stuff. Ideas I've never considered. My pedagogy just went through a huge transition over the last five years, and now I feel like I'm about to go through another one. I don't mind this, I feel this is part of what makes my job enjoyable. I like to problem solve, and now I have more information on what problems I need to solve.​
Picture
Current Data Model of Student Data Power Bi Report
These specific pedagogical solutions to tackling my students' needs can't be designed and implemented via software. These actions currently require a teacher, but what about the data? How will that be handled in the future? Will teachers just rely on software to give them a generic analysis of their students' learning, or will they want to dig deeper? Will they want to know more?  If they do, some new skill sets are going to be required. Teachers will need to know how to access various forms of student data. They'll need knowledge on creating data models that target specific insights of their students' learning. They're going to need some analysis skills and time to be creative afterwards.
It'll be interesting see if these thoughts ever become a real issue. The current focus has been on equity, understanding the cloud, why is the Wi-Fi slow, how to use cloud services like Office 365 and Gsuite, what's the latest new formative assessment tool this month, how do I sign in, why is the Wi-Fi still slow, etc. With all these new cloud services and formative, iterative, and summative assessment tools at our disposal to use (and being used), a lot of data is being gathered on our students' learning. What's all that data doing right now? Is it being used?  Will it be used? Who's going to map it all out? Do they know how? Do they know what to look for?
0 Comments

Office Forms: To Sync or not to Sync (the data)

7/13/2017

4 Comments

 
Once Office Forms became available to use last year, one of the features that really got my attention was its Data Sync functionality. Forms would create an Excel spreadsheet I could download locally to my Surface, and every time I opened the Excel file, the little Data Sync add-in would connect to my Form and refresh my spreadsheet with any new entries. I loved this because it allowed me to design and create Forms I could use continuously throughout the year. I could work with the data I was receiving in my Excel file (queries, tables, functions), and then sit back and let it do it's thing over time. I open the Excel file, Data Sync pulls in new entries, my other spreadsheet tables and functions update themselves with the new data, I hit save, and done. This was really handy when I would create and give a Forms quiz to my students and there were students absent that day (and the day after!). I could work on the spreadsheet that night, connect it to Power Bi, and start doing my analysis of the results knowing that when my absent students take the quiz days later all my files will automatically update and refresh the data after I open them.
Picture
The Data Sync add-in that would pull in new results from an Office Form
Then this went away, and it was a bummer. New Forms I would create weren't syncing with the auto-generated Excel file I downloaded. I'd have to hold out on my Excel analysis fun for  a few days so I could get those absent students' entries into the spreadsheet before I downloaded it to my computer. I wasn't too happy with this.
Well, it's back….kind of.

I'm always messing around with Office 365, and I discovered how to get back the data sync back into my excel files. I'll have to change a little bit of my workflow, but whatever, I got my data sync back. Currently (because hey, this could change) there are two ways to create a Form, and only one of them gives you the data sync-like functionality.
Method 1: Create a new Form straight from the "Forms" app in Office 365

This will create a Form, and give you a spreadsheet, but the Data Sync ability that refreshes your data table is not there. If you want a static spreadsheet in the end, this is how you do it.
Picture
Form created from the "Forms" app in Office 365
Method 2: Create a new Form in Excel Online
Picture
Start in Excel Online
Create a new spreadsheet in Excel Online and then click on the little Forms button showing in the Home tab. Create a Form. Note! You can't create a quiz so you miss out on the quiz features like math and feedback. This new Form will also show up with your other Forms so you know where to find it, share it, and look at the results. The difference is now the Excel button looks a little different, and instead of giving you an Excel file to download, it directs you to Excel Online file where you can see your Form results in a table. And (best part here), this new Excel Online file is stored in your OneDrive for Business folder, and therefore can sync locally to your computer. Now you have a Excel file that updates itself automatically as new entries are submitted via the Form.​
Picture
Form created through Excel Online
There is a caveat though I've learned through some trial and error. If I mess around with the synced Form/Excel File (locally and online) like creating new columns and functions in the data table, this breaks the sync connection. The Excel file will no longer import any new responses from the Form.

So, what do I do then? I still want to mess around with my data. It's actually pretty easy, I just create another "Master" Excel spreadsheet and start querying the data. The data coming in from the Form is sent to the Excel Online file, which is synced to my computer. I just query the data table from that data-syncing Form/Excel file stored on my computer and voilà, I have the same data showing up, and it can be played around with. As new entries are submitted, the data is synced to the data-syncing Excel-File-That-Must-Not-Be-Touched, and when I refresh my query from my "Master" spreadsheet, all the new rows of data appear. Yay!

So yeah, my methods will change for next year, but now I've got my data syncing back :-)
4 Comments
<<Previous
    About Me 🙂

    RSS Feed

    Tweets by @AndrewNRoxanna

    Categories

    All
    CSULB
    ETEC 551
    Flipgrid
    #MIEexpert
    Mieexpert15
    MS Office
    Office 365
    Office Lens
    OneNote
    PowerApps
    Power Bi
    Surface Pro

Proudly powered by Weebly