Student Assessment Data 2020
This year's Power Bi report includes new data from my Mastery Rubric PowerApp and my classroom music theory assessment app.
DEVELOPING CLASSROOM APPS WITH POWERAPPS (2020)
|
New Music Theory activities have been developed for the Elementary K-5 Music Students in my district.
This one starts with the basics: Identifying Line or Space? |
|
|
Identifying Line and Space locations on the Music Staff
|
|
|
Identifying Note Names on the Treble and Bass Music Staff
(treble pictured) |
|
|
My One Rubric to Rule them All PowerApp!
I use this app to score/assess students work, regardless of which music domain (reading, writing, performance, listening) the classwork encompasses. Mastery Standards and their related score-affecting issues dynamically change based on which domain is selected. Resulting data is saved for longitudinal analysis of students' mastery of musical concepts and skills. What skills are students struggling with and why? Using this information, differentiated activities can be created to help students struggling in the identified areas of standard mastery. Scores for individual assignments are automatically tabulated, exported into a CSV file, and sent to the user's email inbox for easy CSV import into a LMS gradebook. Ignore the red error bug at the end of the video |
|
|
Here is a classroom behavior frequency prototype PowerApp I began using this year. Music ensembles don't sit in straight rows, so your run-of-the-mill seating chart applications won't cut it. Student colors are based on instrumentation, behavior items (right item box) are taken straight from our school's behavior log document.
|

|
Developing Classroom Apps with PowerApps (2019)
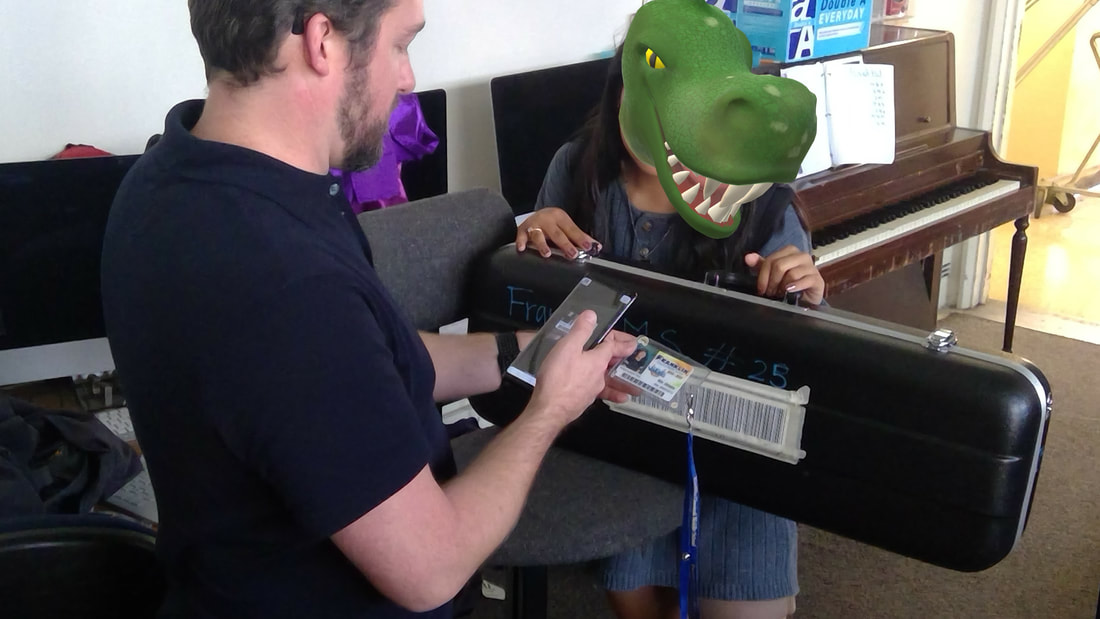
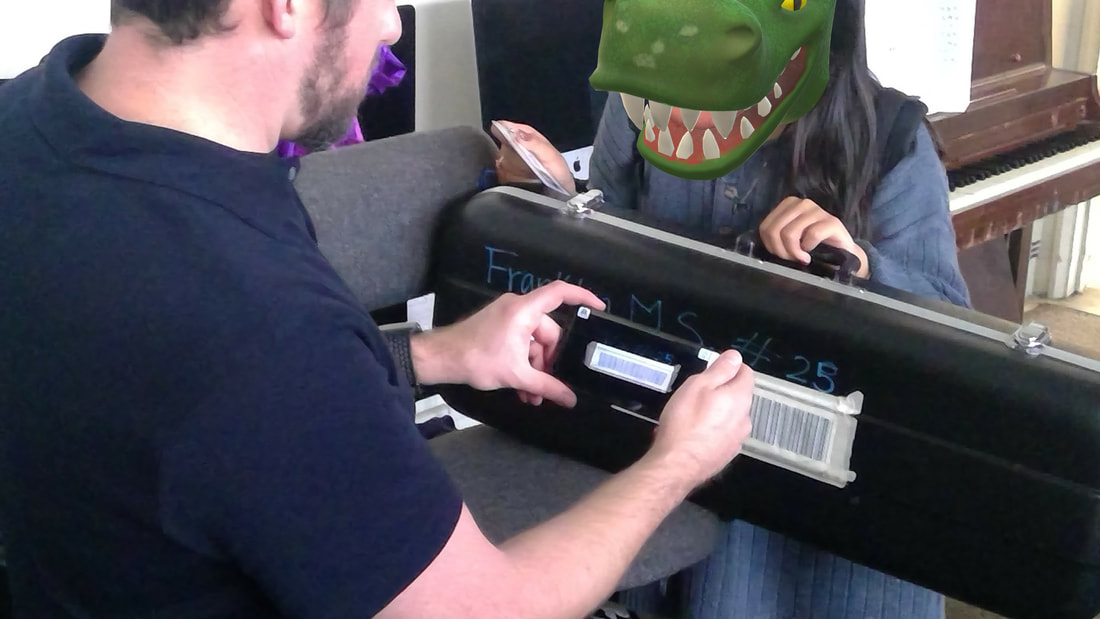
After a couple years of messing around with PowerApps/Project Sienna (a member of the Office 365 Power Platform Apps), I created my first working application to use in my classroom; an Inventory Assignment app to keep track of my classroom materials being assigned to my 250+ students. After getting the hang of the algorithm syntax, I moved onto a barcode scanner app to keep track of my instrument checkouts. I have since developed more PowerApp applications for classroom routines and curriculum assessment
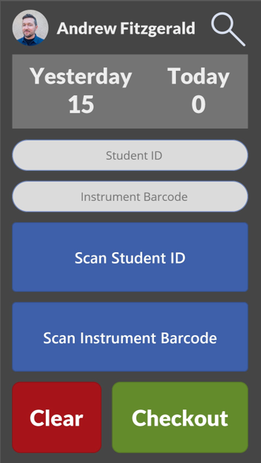
I use this PowerApp everyday to checkout our school instruments to my students taking them home for the day. The app uses my phone's camera as a barcode scanner to scan student IDs and custom barcodes.
|
|
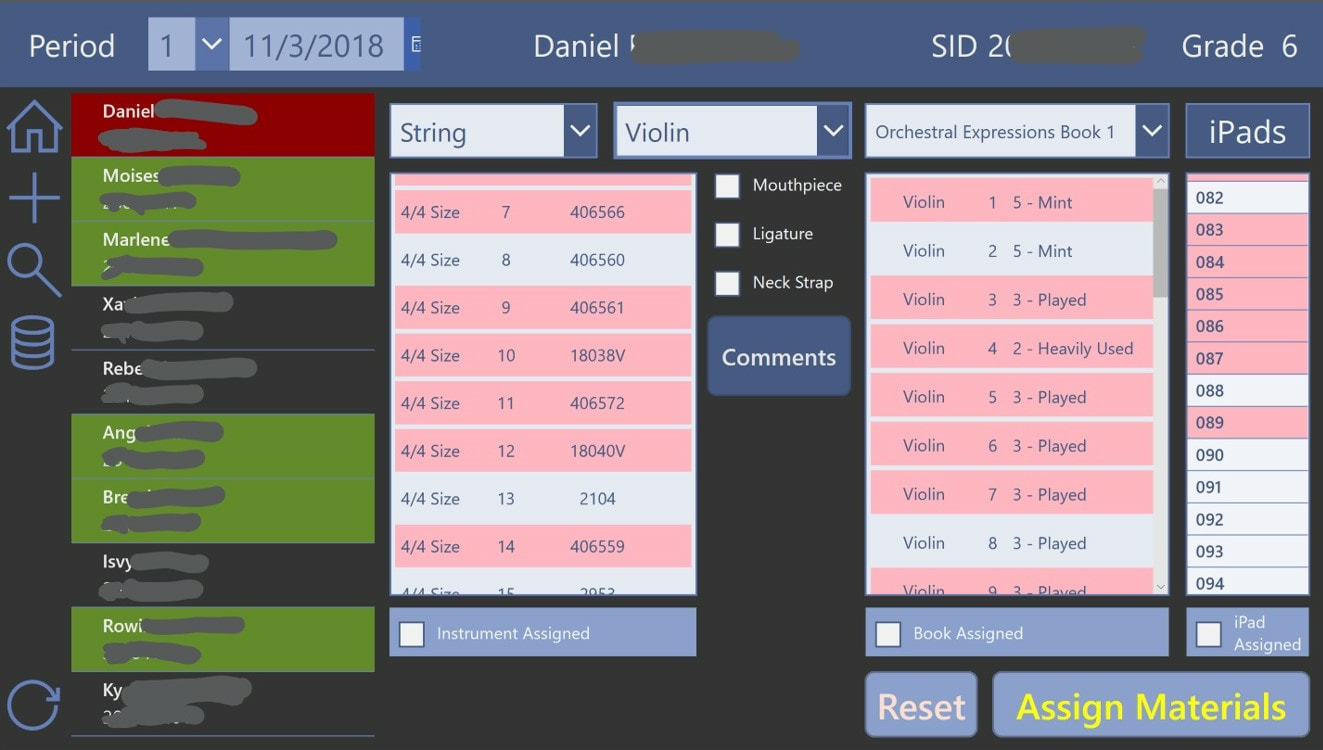
This PowerApp is used to lookup and assign classroom inventory materials to my students. Materials include instruments, mouthpieces, accessories, method books, and iPads
My first PowerApp for theory assessment. Students are assigned scales to create, use the app to create the Major/minor scale, and then submit their answers. Submitted answer data is analyzed in Power Bi to tally scores, show trends in mistakes being made.
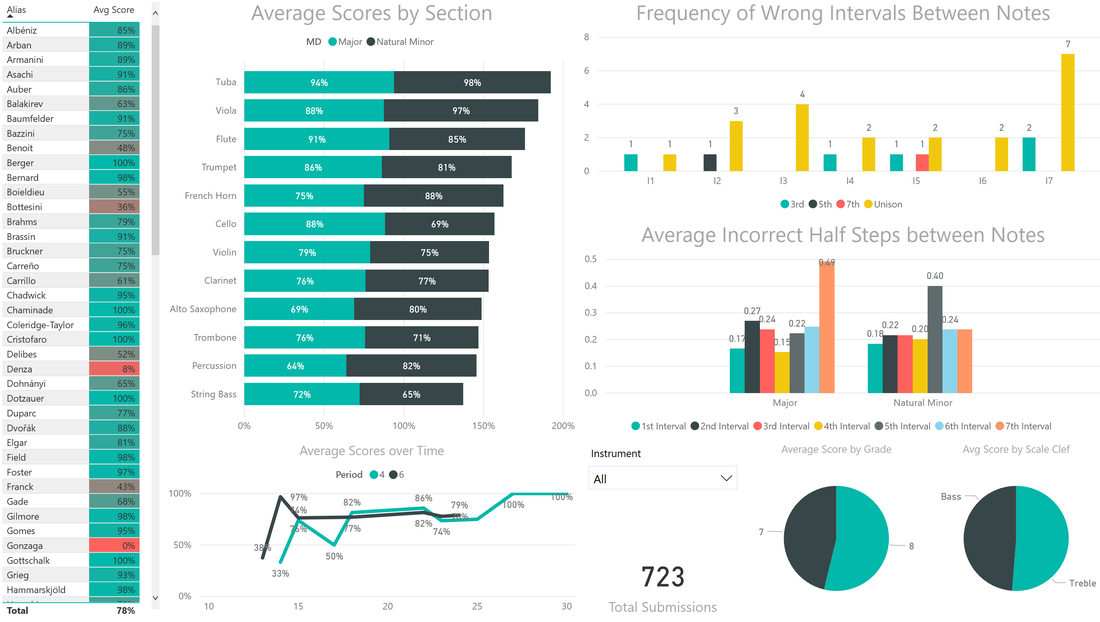
My student's answers are written to a spreadsheet table, which then gets imported into Power Bi. Working in Power Bi, I create algorithms and organize the assessment data for my students and me to see.

For this assessment, my PowerApp generates 10 random Intervals for the students to create and turn in.
The Power Bi report page of data related to my students' Interval submissions.
Student Data 2018-2019
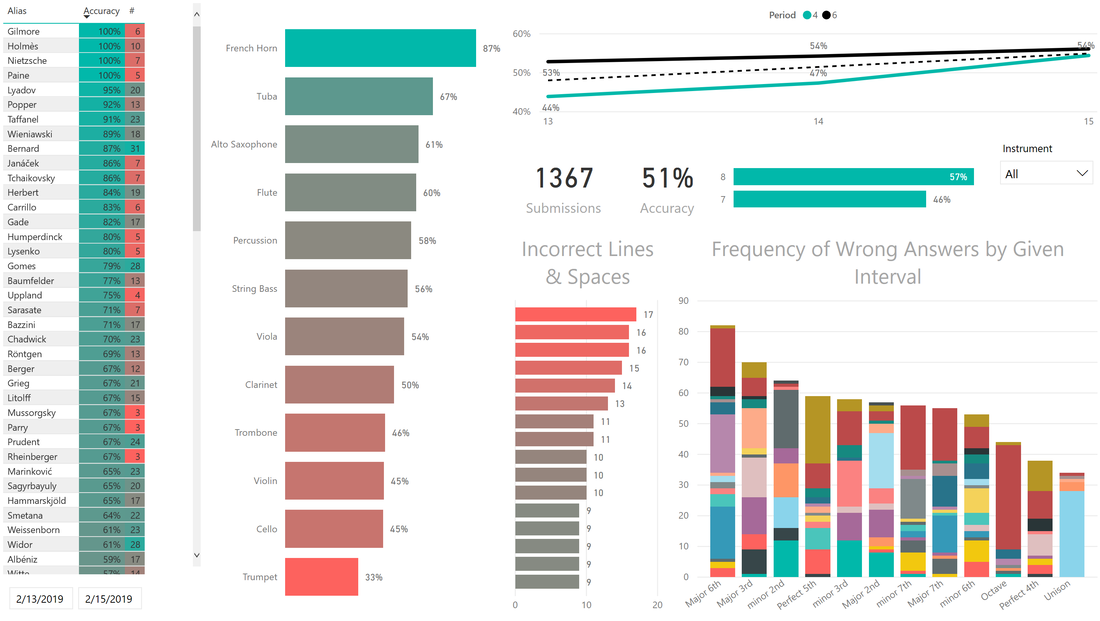
Below is my public Power Bi report of classroom data being collected during the 18/19 Academic year. It basically mirrors the previous year's report, but algorithms and charts have been updated to give better insight. Instrument checkouts now display a daily % rate based on the number of students in an instrument section (per class) checking their instrument out vs. maximum available instruments. This way I can see which instrument sections (per class) are working harder than others at home.
Theory assessment data now includes data collected through my Theory Assessment PowerApps (Creating Scales). Intonation/listening data collected in my String Orchestra class now shows the string frequencies being played in class, students' intonation assessment of the string frequency (flat, sharp, in tune), listening accuracy over time, and more 😁
Peer/Teacher assessments are just the same, as that activity worked out well for my advanced classes last year.
Student Data 2017-2018
This Power Bi report is a collection of student data collected over the course of the 17/18 academic year. Data includes inventory checkouts, Theory Assessment scores (Max values to demonstrate mastery), Peer/Teacher Assessment scores, Intonation/Listening accuracy for my string players, and some ELA assessment/intervention data. Data was used for formative pedagogical decisions regarding curriculum, revisiting concepts, feedback, and student analysis for class projects.
Conference Session Presentations (2015-Present)


MUSD ED CON Keynote Speaker (2016)
Microsoft Surface Video/Advert (2016)
Capstone Thesis (2015)
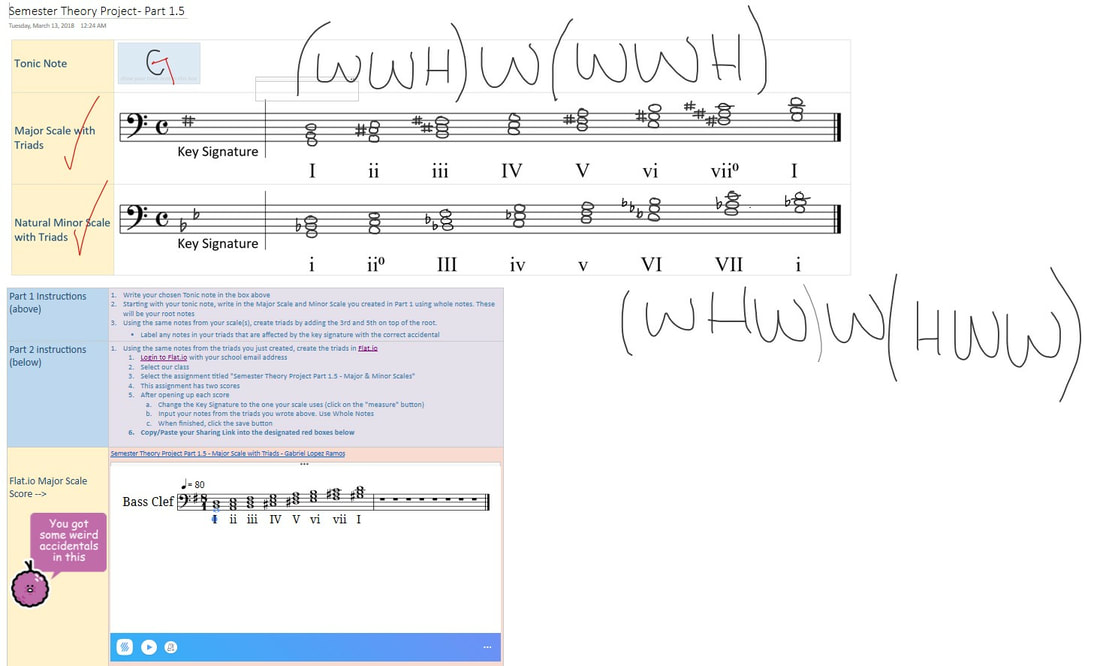
Student Semester Theory Projects (2018)
|
The goal of this project is for my 2nd and 3rd year students to apply their music theory knowledge and skills to create music. Nothing too complicated, just 16 bar tunes that follow some specific parameters. The project has many scaffolded steps, completed throughout the 2nd semester. For each step, students write rough drafts in OneNote, and then transfer their drafts into Flat.io, and online music notation editor for classrooms.
|
Students complete their rough drafts in OneNote before moving their work into Flat.io
|
|
Part 1
Students choose a Tonic note (G in this example) and find the notes in their chosen Tonic's Major scale. They complete this using Major mode formula WWHWWWH |
|
|
Part 1.5
Using the same tonic, students find the notes in the Natural Minor Mode using the formula WHWWHWW |
|
|
Part 2
Students find the Major/Minor triads associated with their Major scale. This part is also done in Bass Clef. |
|
|
Part 2.5
Students find the Major/Minor triads associated with their Natural Minor scale. This part is also done in Bass Clef. |
|
Part 3
This activity is done in two steps. In the first step, using the notes in their Major scale, they create a 16 bar melody. They begin/end on the tonic, and measure 8 has to feature the dominant note of their scale. In the 2nd step, my students do some analysis of their melody to find which triads will fit to create harmony. Students have creative freedom regarding rhythm and dynamics, and are encouraged to incorporate some basic musical patterns that work well. The students' music is also required to end with a cadence.
This activity is done in two steps. In the first step, using the notes in their Major scale, they create a 16 bar melody. They begin/end on the tonic, and measure 8 has to feature the dominant note of their scale. In the 2nd step, my students do some analysis of their melody to find which triads will fit to create harmony. Students have creative freedom regarding rhythm and dynamics, and are encouraged to incorporate some basic musical patterns that work well. The students' music is also required to end with a cadence.
Part 3.5
Students do the same as Part 3, but this time using the notes and triads from their Natural Minor scale.
Students do the same as Part 3, but this time using the notes and triads from their Natural Minor scale.
The STEP Story (2014)I originally created this video for a presentation at a Gates Foundation retreat. I am a part of a group of teachers involved in an ongoing research study. The version has my voice-over narration, and was used to present at a recent School Board meeting in Long Beach. Someone recently asked me how I made the video. This is how.
1) Created graphics using BitStrips website 2) Edited graphics using Photoshop 3) Inserted graphics and story text into Adobe InDesign, and designed each page. 4) Exported from InDesign to ePub, PDF and PNG image files 5) ePub and PDF Files became the downloadable book (No audio/animation). PDF files were used for printing 6) PNG files were inserted into PowerPoint. I applied the page turning graphic, an then exported the PP as a movie 7) Imported the PP movie into Adobe Première, where I was able to edit the duration of each page, add narration, and add and edit the music. 8) Saved as a mp4. file and violá! Storybook Movie :-) |
|
School Board Presentation (2014)I was asked to present at the LBUSD's School Board meeting about my experience with the STEP program. Particularly the challenge I faced gathering data on my student's usage of Academic Vocabulary, one of the instructional shifts in the Common Core State Standards adoption.
tl:dr version: I figured it out. Below are the PP slides I made to coincide with my speech. |
|
Student Portfolio Websites (2015)
As I introduce technology into my curriculum for students to create digital artifacts, I really need somewhere to put them so parents, students, faculty, and others may see them. I've created two websites, one for my music students, and another for my new multimedia class. Click on the images below to check out their work.
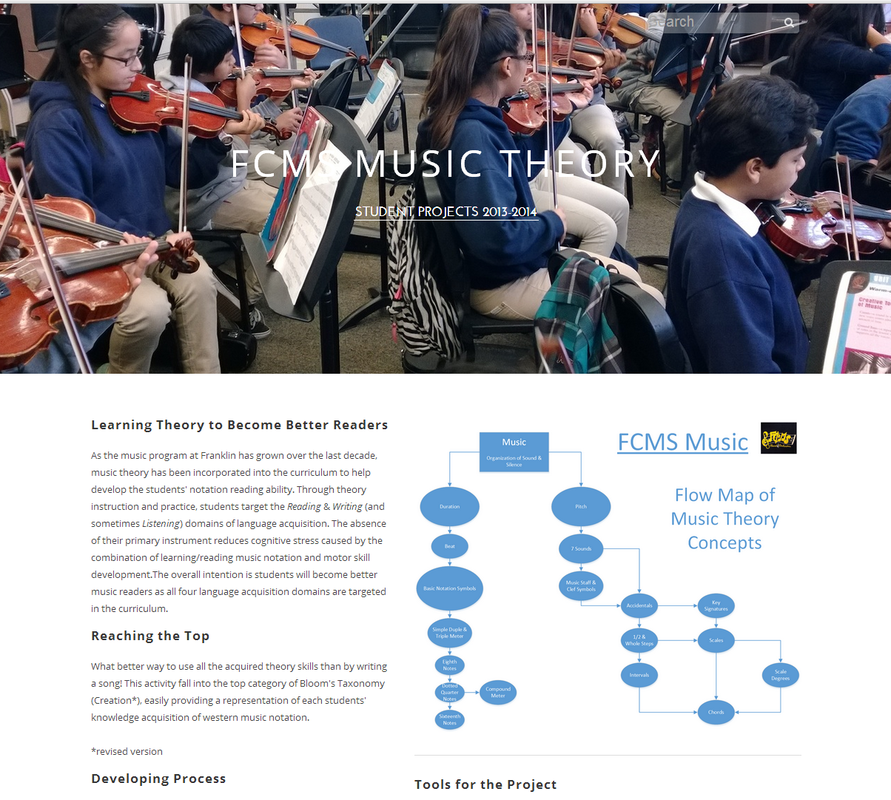
Advanced Ensembles
|
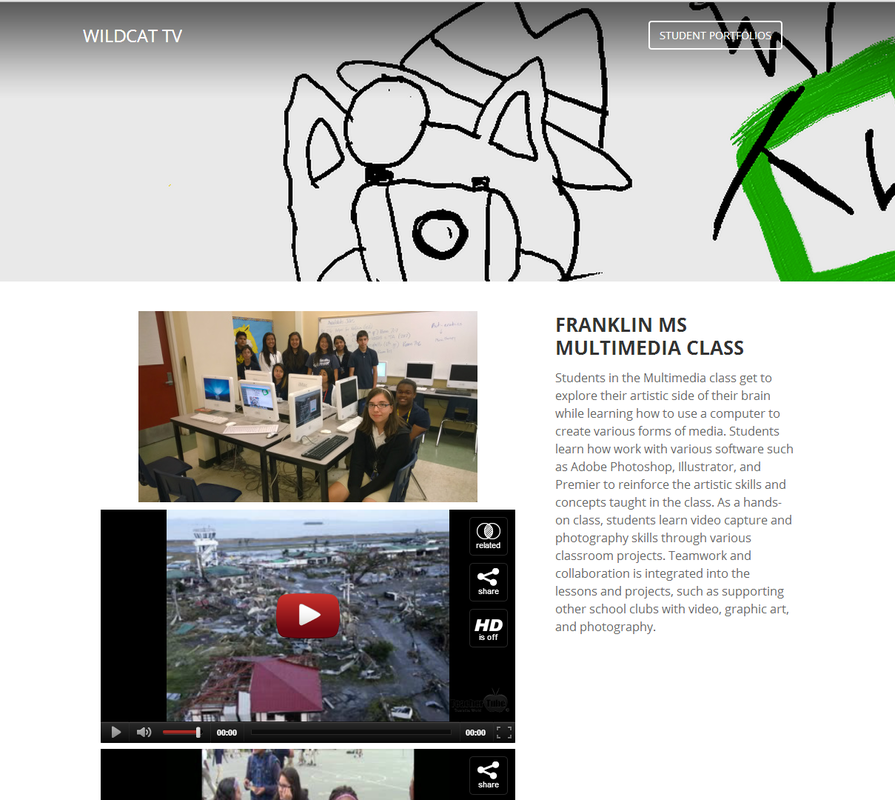
Multimedia Class
|
Education Celebration Website (2014)
|
This was my first attempt at a Weebly website. I created it to give my school an edge in the district's Education Celebration. I created a big QR code for it and slapped it onto our huge display board. We had iPads on hand so parents could peruse the website if case they didn't have a smartphone with them. Unfortunately, the provided WiFi signal was horrible, so we were never really able to make it work the way it was supposed to :-(
Click on the image to go to the website, or you can scan this QR code :-) |
|