This is part 2.5 of a series of posts I'm writing on my past school year using various edtech tools for data-driven interventions
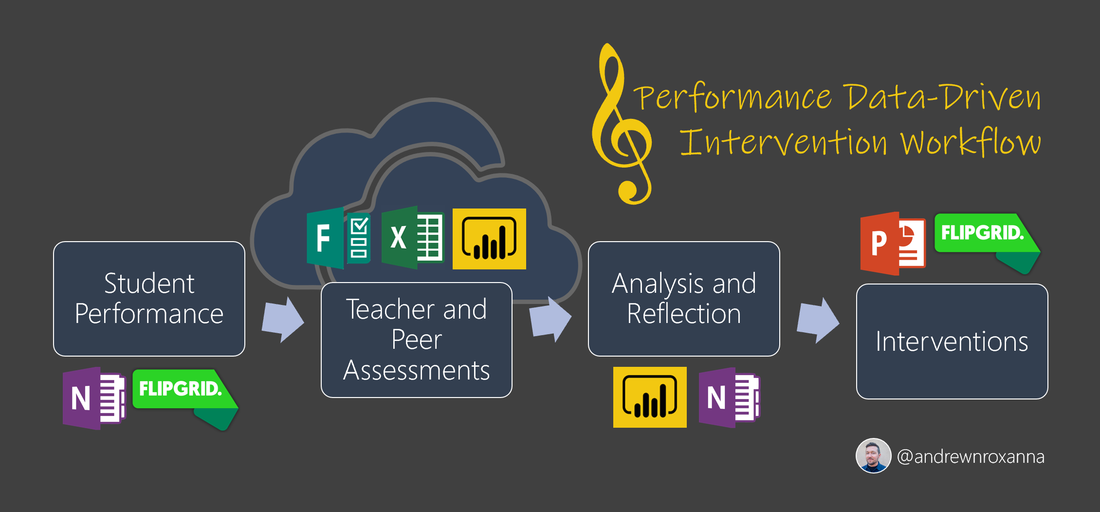
,After my students completed their first round of Flipgrid recordings and peer assessments, I had rows of data in my Form/Excel files stored in my OneDrive. Now it was time to set up my Power Bi report that I would share back to my students. For this project I was using the Power Bi Desktop application, and for several reasons:
- I could import multiple data tables from various Excel spreadsheets into one Power Bi file.
- Creating relationships between data tables in Power Bi is super easy.
- The desktop app includes a Query Editor. This means I could make the changes to the data I needed to make without changing the original data stored in the Excel files.
- I gave me the ability to hide table columns that have identifiable information like my student's name, SID, and email address. People wouldn't be able to see that information if they selected "See Records" in a chart.
- I could create new columns in a data set and write formulas for them.
- It included some visual formatting tools I wanted access to, like "Send Backward"
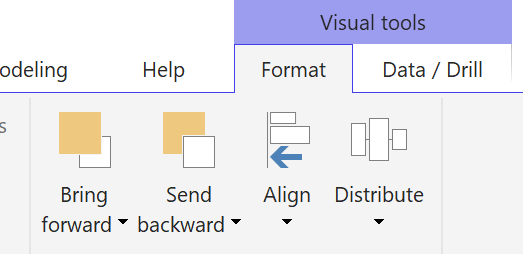
These desktop app tools are important to me
There are a couple methods of getting and installing Power Bi on your PC, but if you have a Windows 10 machine, I recommend getting it from the Microsoft Store. That way you'll automatically receive updates and won't have to do any monthly manual updating yourself.
My Power Bi file lived locally on my Surface Book in my work OneDrive in the same folder as my Form/Excel assessment files. I did this to help me keep my stuff organized, but it turns out keeping a Power Bi file in my work OneDrive space allowed some automatic data updating to happen in the background. More on that in a bit.
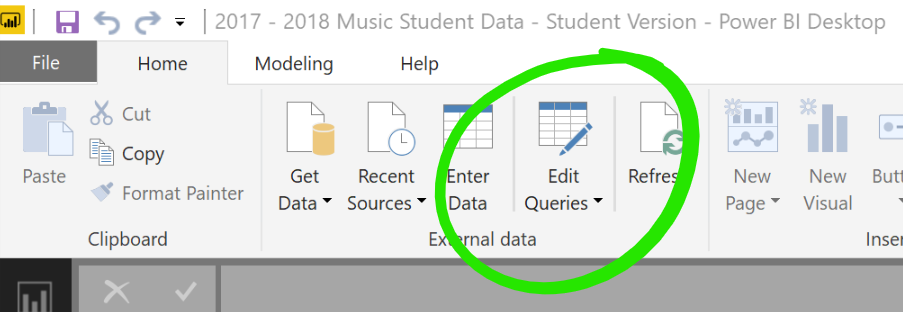
Once I was in my Power Bi file, I queried my assessment data using the Get Data button and selecting my Form/Excel files. After bringing the data tables into the application I had to do a few things to get my visuals to look the way I wanted them to look.
My Power Bi file lived locally on my Surface Book in my work OneDrive in the same folder as my Form/Excel assessment files. I did this to help me keep my stuff organized, but it turns out keeping a Power Bi file in my work OneDrive space allowed some automatic data updating to happen in the background. More on that in a bit.
Once I was in my Power Bi file, I queried my assessment data using the Get Data button and selecting my Form/Excel files. After bringing the data tables into the application I had to do a few things to get my visuals to look the way I wanted them to look.
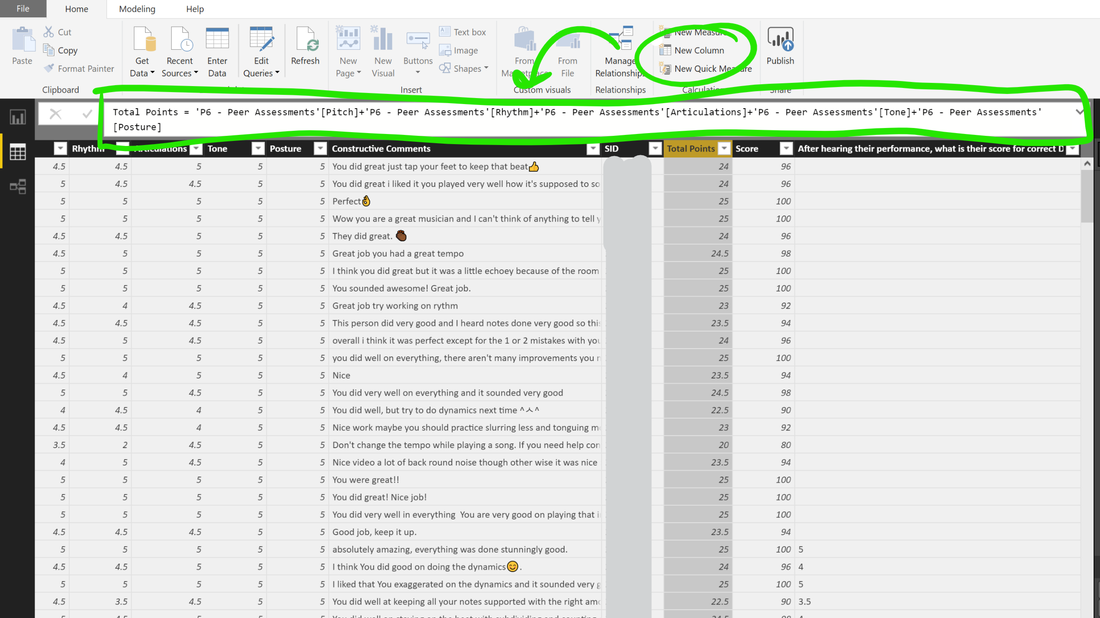
Creating new columns
I had rubric scores for performance categories, but I also needed the scores added up (maximum 25 possible) in a separate column to get a Total, and then multiple that number by 4 to get a Score in another column. In the past I would have done this in Excel, but now I can leave the original data tables alone in their Excel file and do all my edits in Power Bi. I clicked the New Column button, wrote my formula for that column, and voilà! Done.
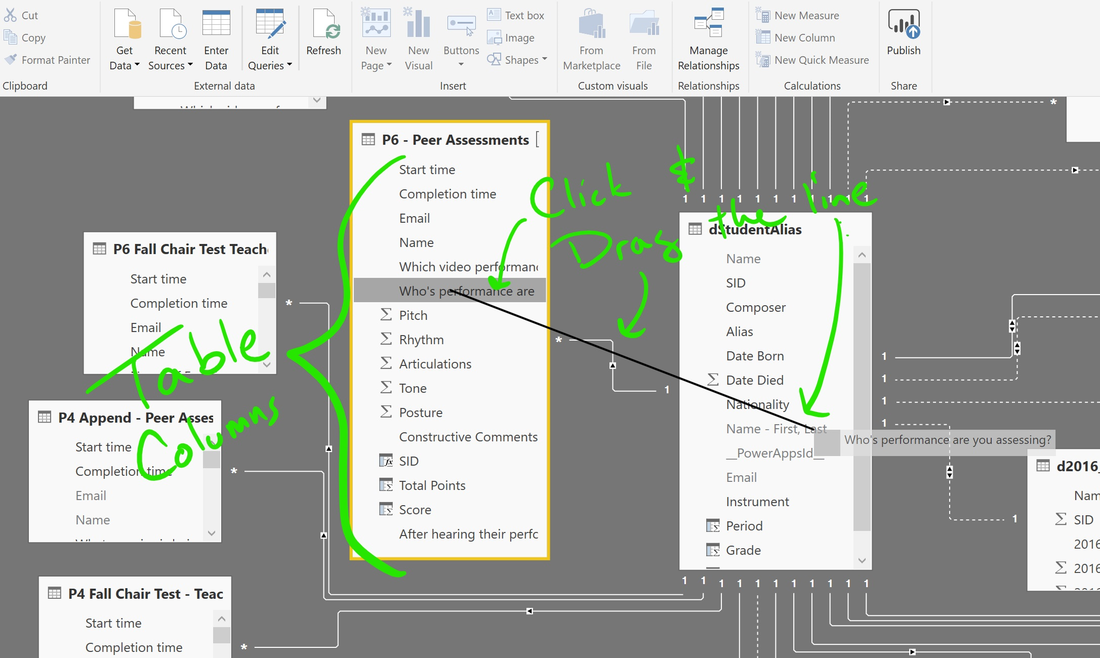
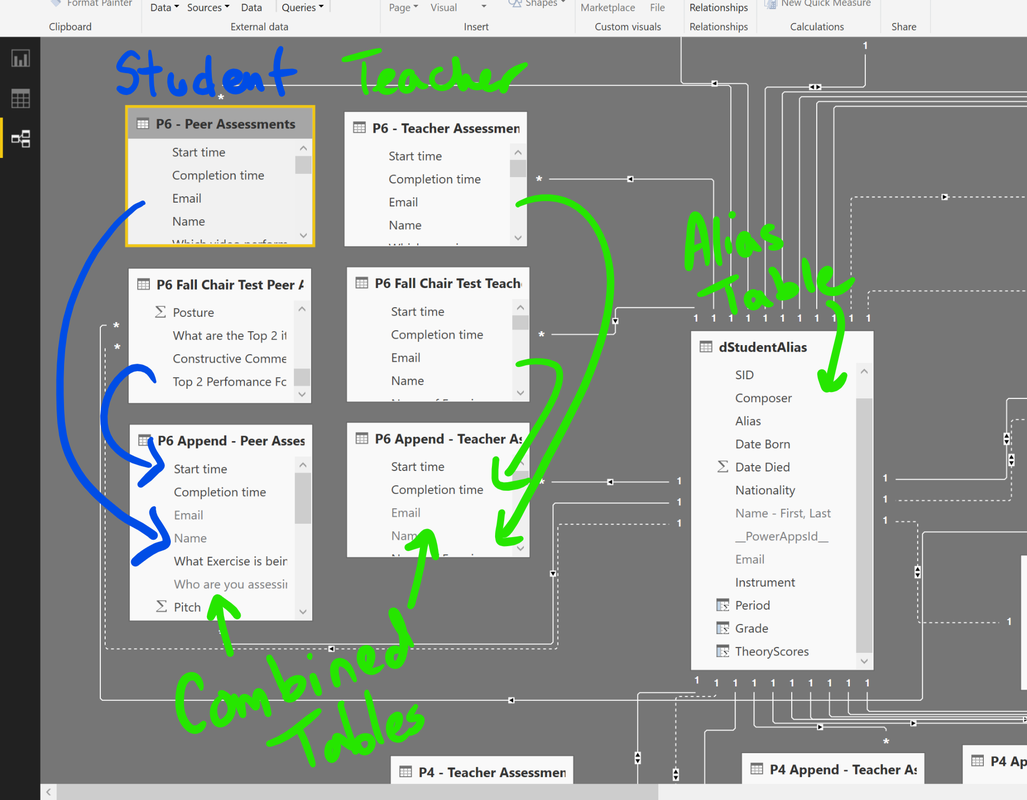
Creating relationships
Since I was using alias codenames on my shared report. I had to connect my Peer Assessment data table (that have my students' names) to my Alias table (also has students' names) by creating a relationship between them. From the Relationships view in Power Bi, I found which columns have the same values, and it's as easy as clicking on one column and dragging the now visible line to the other column. SOOOOO much easier than Excel.
Edit the data without messing up the original set
My students did a big Fall chair test assessment. Every student performs in the class and receives a peer assessment from every present student in the room (around 50). I created a new peer assessment form for this, because I was asking some new questions, but now a I had two separate sets of peer assessment data. My Flipgrid assessments and my chair test assessments. I needed these data sets together, so I could keep all that data in the same visual and keep it linear. Thankfully, Power Bi is awesome and can do that. I opened the Query Editor and used the Append button to combine the two tables into one. I had to do some editing of the original column names, so the program would see the match, and silly me also forgot to give the chair test assignment title a number at the beginning. No problem, I just did a find/replace, changing "Honor Band Audition" to "3 - Honor Band Audition". Now my data visual wouldn't lose the progressing linear awesomeness I had created.
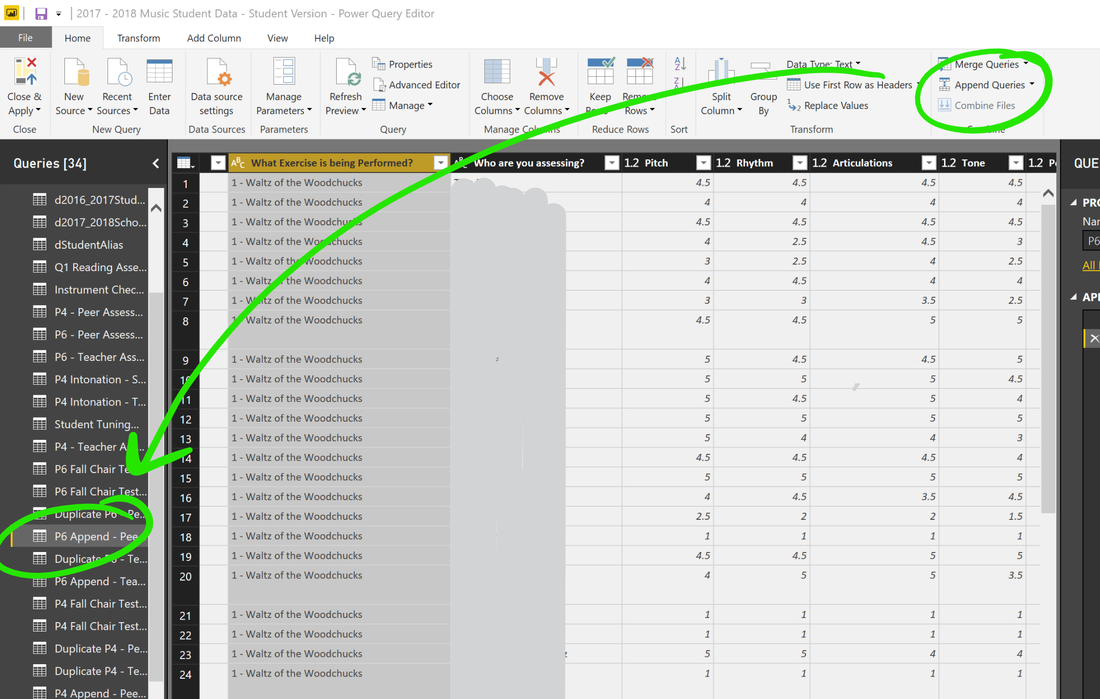
Append separate tables together
Combining tables together to keep everything together
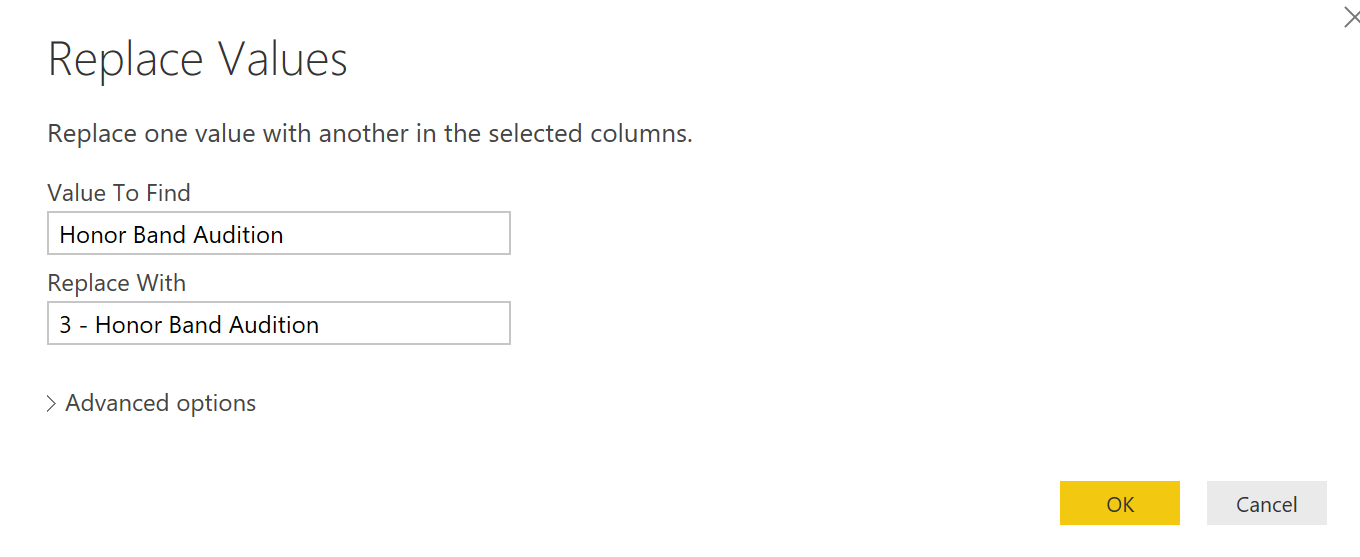
Doh! had to replace a value
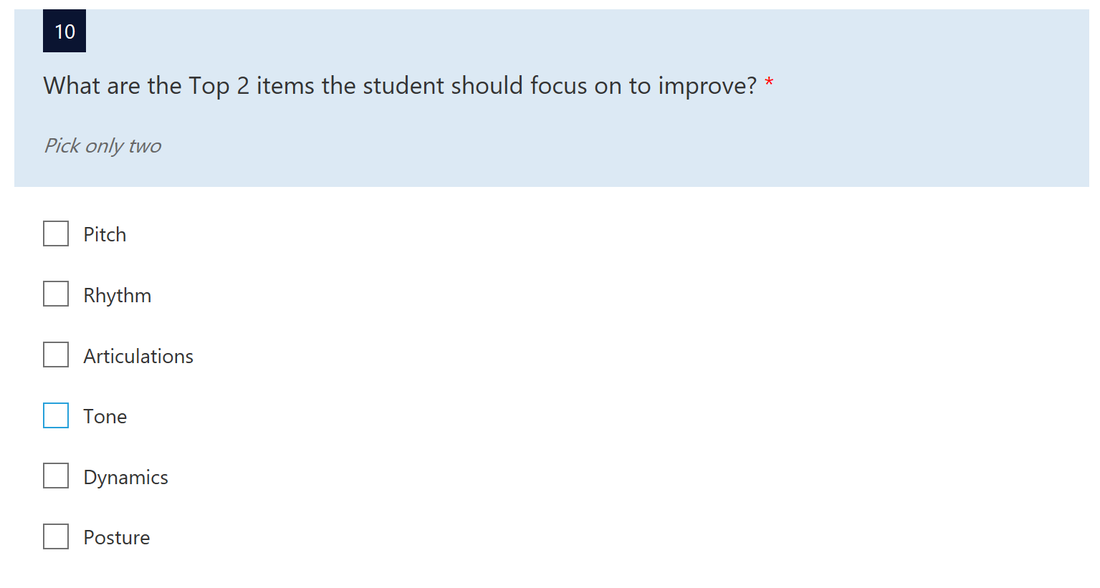
New question, new issue to figure out
This was a new peer assessment question for the Fall chair test. Students would choose two, and then I wanted to show the frequency of the chosen options in a word cloud. It worked, but I had to take some steps to clean up the data. The original answer data would format both student-selected options as "option;option;". For my word cloud to work, I needed to get rid of the semi-colons and keep a space between the words. I made this work in the Query Editor. I duplicated the column, and then used the Extract button to get rid of the semi-colons and add my space. Now my word cloud was set ?
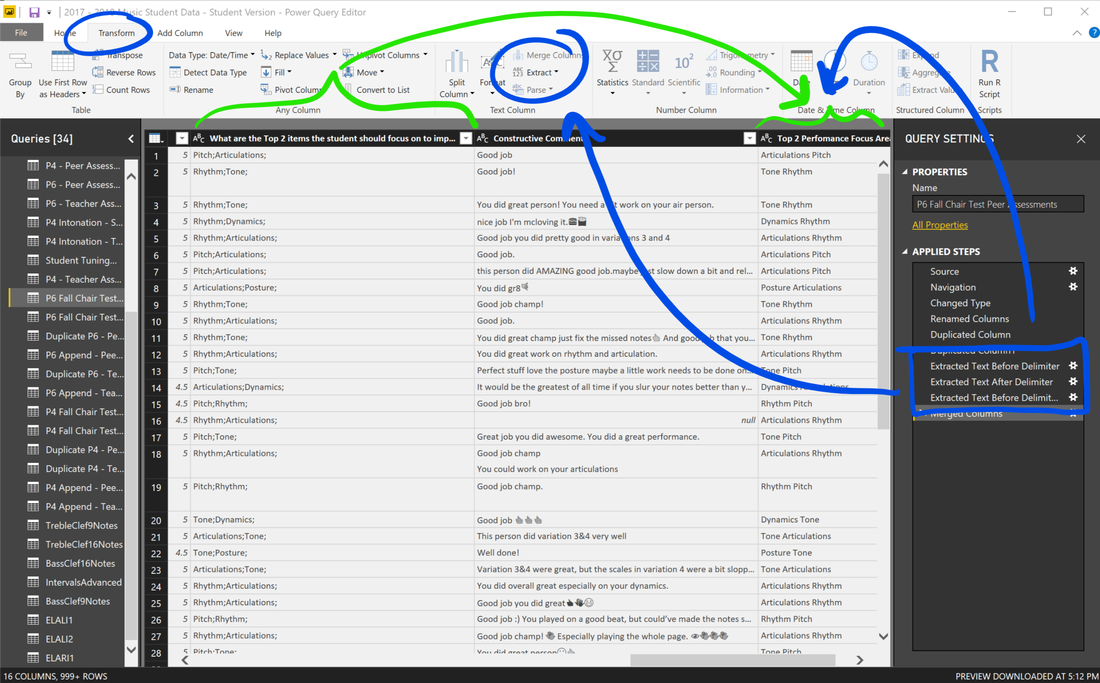
Extracting the semi-colons to get rid of them
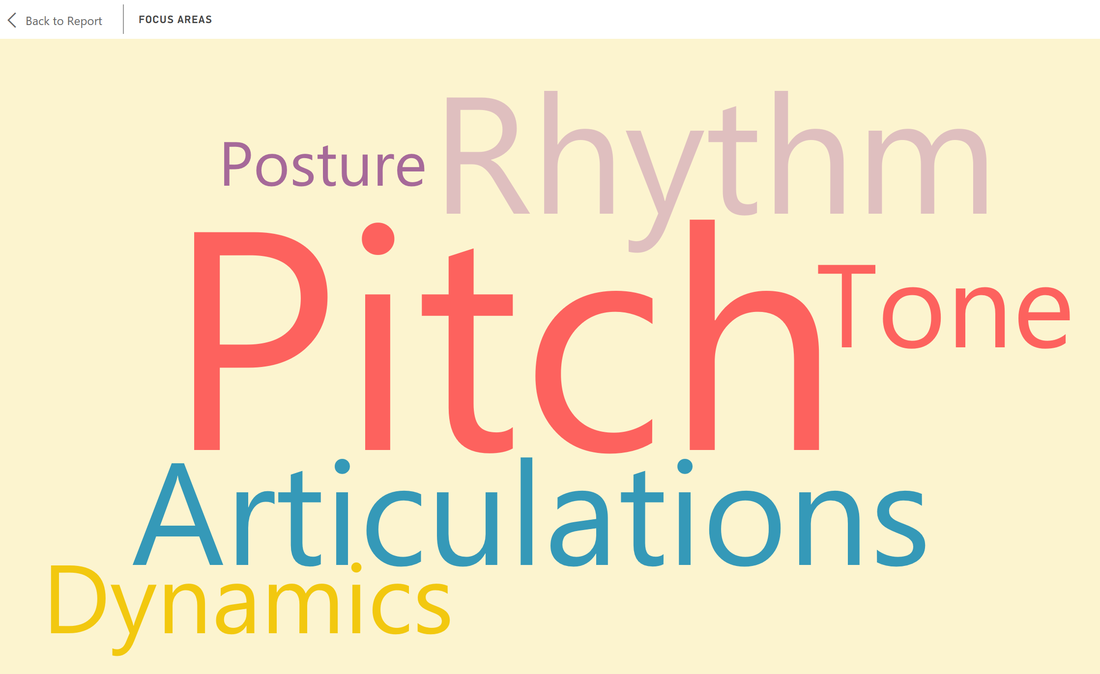
Got my word cloud working!
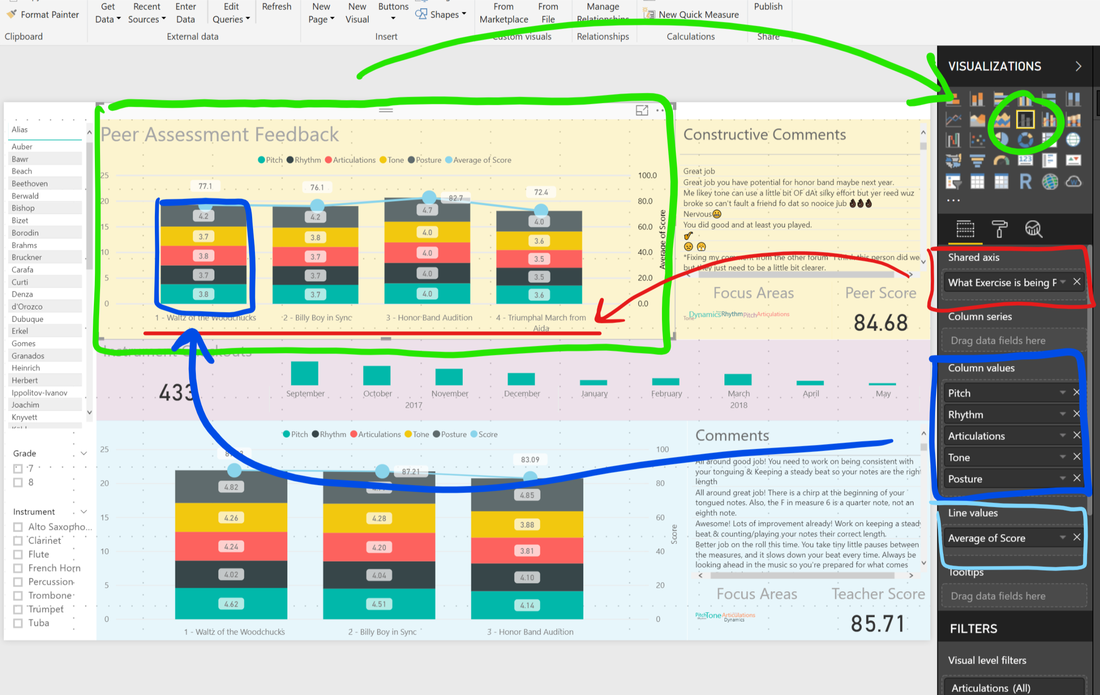
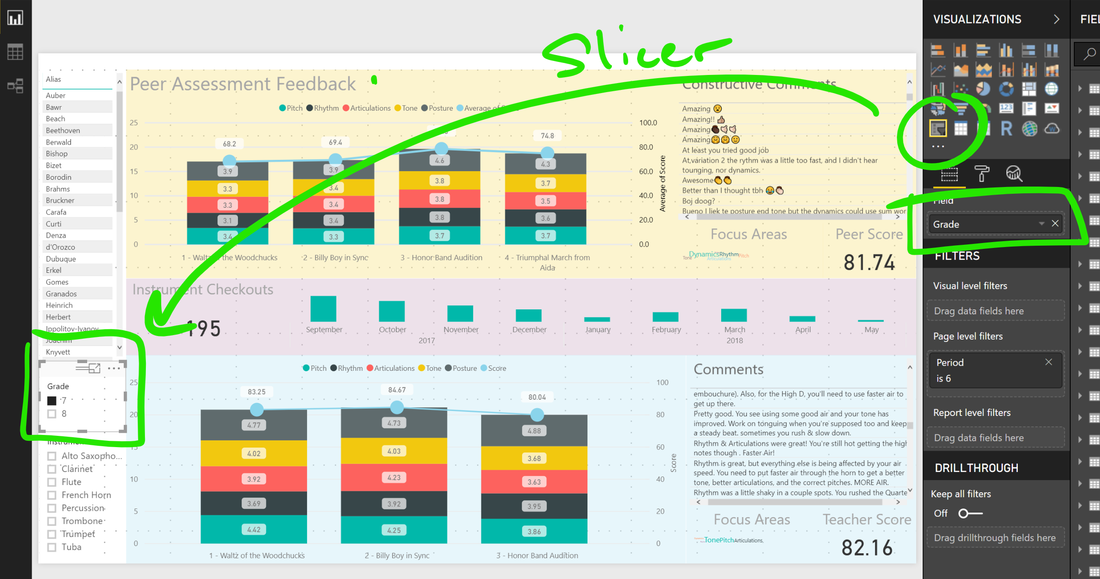
Creating my assessment scores visual
At this point everything worked perfectly as I created my visuals. I really like the visual editor in Power Bi, and every update (about once a month) it gets more intuitive and also gets new features. It's really just dragging and dropping table columns onto a canvas, choosing the right visual, and then making it look visually appealing and intuitive for students. My assessment report page included both the Peer Assessments and Teacher Assessments, comments, focus areas, instrument checkouts (from another data source/point I was collecting), and slicers so my students could filter their data out and compare it to their grade level(s) and section(s).
When I was happy with what I created, I clicked the publish button in the desktop app. This process would take my report file and send it to my Power Bi space in my Office 365 account. After visiting the published report in the browser, I "published it to the web" which created a public link that I could share with my students. All my data had been anonymized and hidden, and you better believe I constantly checked on this throughout the year. Pasting the link on a page in our OneNote Class Notebook automatically embedded the webpage/report on the OneNote page, which made it visually super easy for my students to find and load up.
The report pops right up in OneNote
Because I chose the "Publish" button on the desktop app to send my finished report up into the cloud, I still had to manually update the report as assessment data was coming in. I had a couple options for this:
I chose the latter but did run into some network firewall issues on my district Wi-Fi where the Gateway app couldn't connect to the internet. So when I wanted to update the report, I would hop over to my personal hotspot, run the update, then hop back over to my district Wi-Fi.
- I could open up the Power Bi report file, click refresh, let it pull in all the new data from the Form/Excel files, then hit Publish and send the updated report back into the cloud.
- I could install and use the Power Bi Personal Gateway application onto my computer. This program would let me create scheduled times where the Gateway app would do all the updating/syncing process in the background on my Surface and also let me start the process manually in the web.
I chose the latter but did run into some network firewall issues on my district Wi-Fi where the Gateway app couldn't connect to the internet. So when I wanted to update the report, I would hop over to my personal hotspot, run the update, then hop back over to my district Wi-Fi.
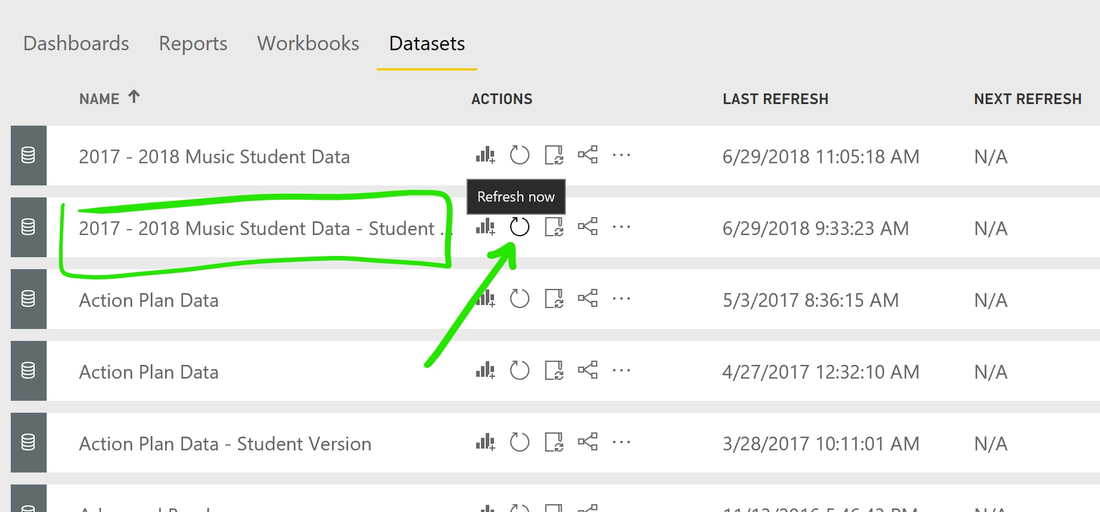
Manually refreshing the data sets connected through the Gateway app
Something I didn't realize I could do at the time was start the publishing process from Power Bi in the web. Here it is:
The benefit of this method is that it allows for automatic hourly updates without needing the Gateway app, but I'm not exactly sure it can connect to my data sources to pull in new data. I have to test this out. If it works, it'll be my new process.
- Use Power Bi desktop to create my report. Save my file to my OneDrive.
- Go to Power Bi in the web, hit the "Get Data" button, and find the Power Bi report file. Upload it to Power Bi.
- The report is published to my workspace, just like the other method.
The benefit of this method is that it allows for automatic hourly updates without needing the Gateway app, but I'm not exactly sure it can connect to my data sources to pull in new data. I have to test this out. If it works, it'll be my new process.
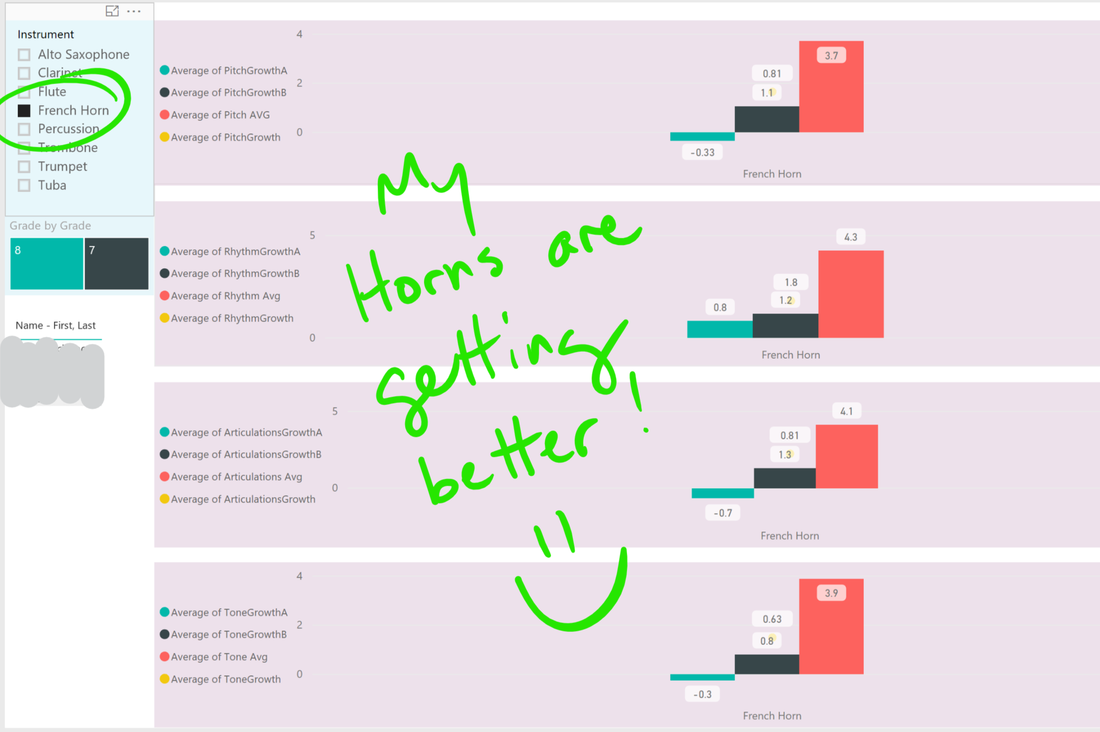
A view from my personal report file
Throughout the school year I added more and more assessment data to the report file. I designed a cool string intonation activity with my string kids, we did music theory assessments, instrument checkouts, and ELA stuff too. I also had another Power Bi report file running at the same time that was only for me to see. In this separate report I could see student names, create quick charts, and mess around with my data to see if I could get more information out of it, like how do my student's peer assessment scores for Johnny's Flipgrid recording compare to my assessment scores for the same recording? After I find those differences, is there a student whose scores are constantly irregular? If so, what does it mean, and what do I do? Interesting stuff. My personal report file was also my testing ground for writing my column formulas that I would use in the public student report.
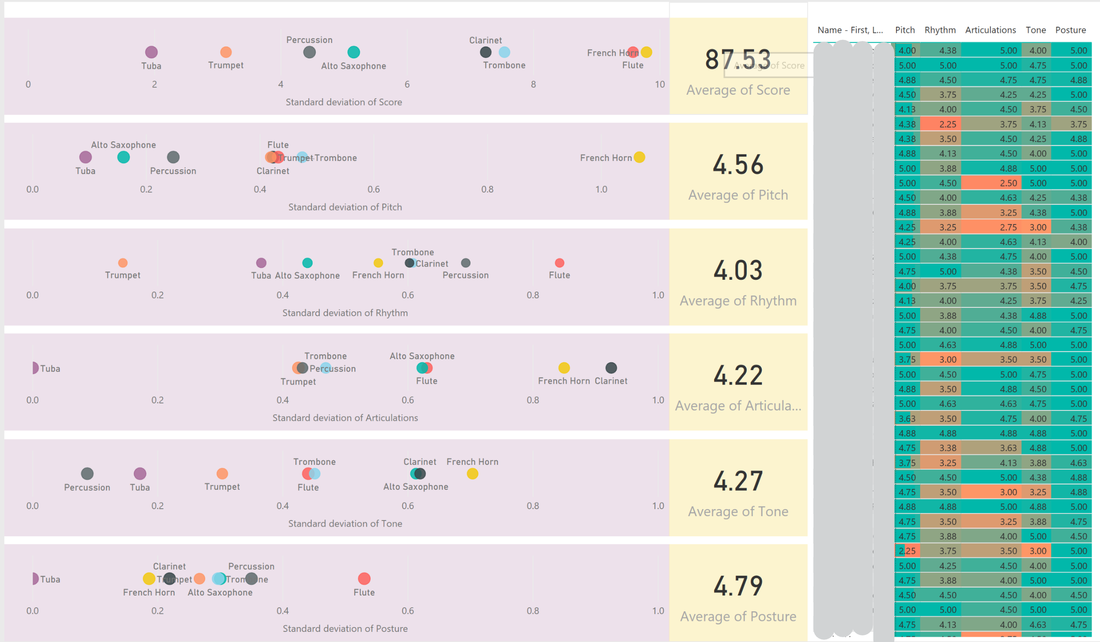
Looking at standard deviations of listening scores because why not?
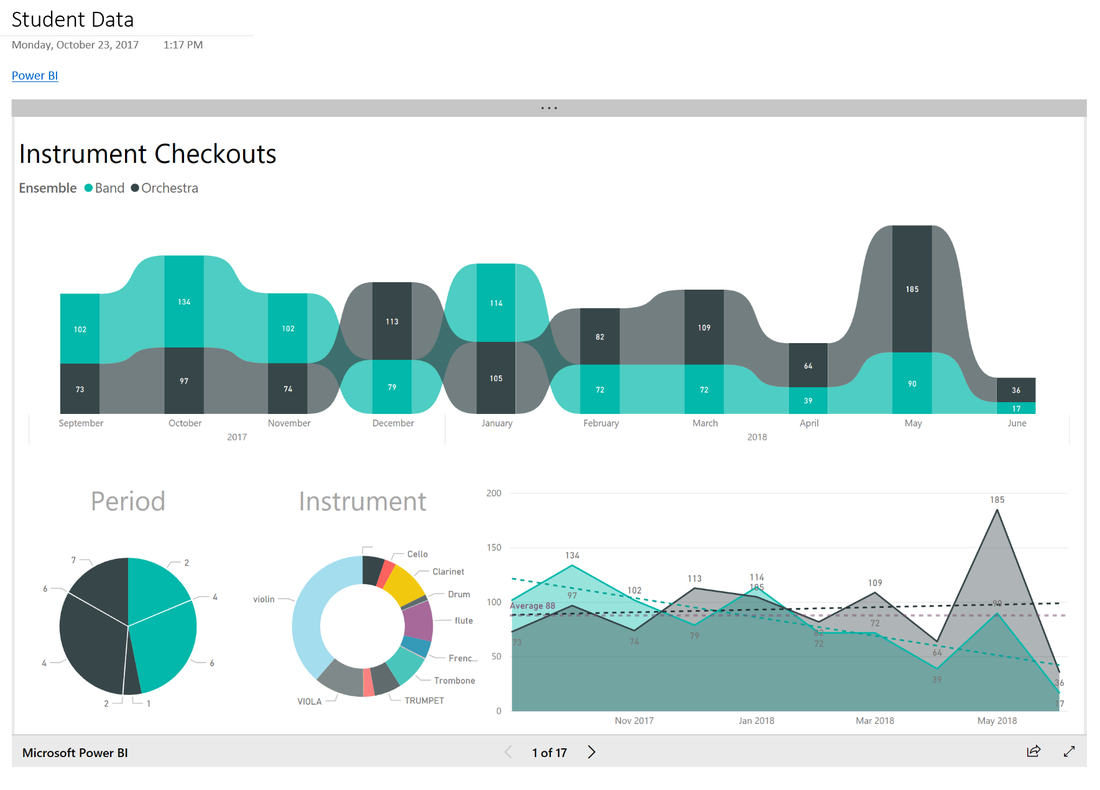
My public student report can be seen below. This is what was shared with my students. Performance assessment data is on pages 4 and 6.
Putting this together was a learning experience. I would run into roadblocks as I added more and more data to the report, and I would get stumped from time to time writing the algorithms I needed. I found help by reading/lurking the Power Bi community forums for answers, and the more I practiced, the better I got. When this upcoming school year begins, I'll already have a working system with working algorithms in place.
This was only a step in the whole data intervention process though. Now that the data was mapped out, what would the students and I do with it? That part will be up next ?
This was only a step in the whole data intervention process though. Now that the data was mapped out, what would the students and I do with it? That part will be up next ?
 RSS Feed
