This is part 2 of a series of posts I'm writing on my past school year using various edtech tools for data-driven interventions.
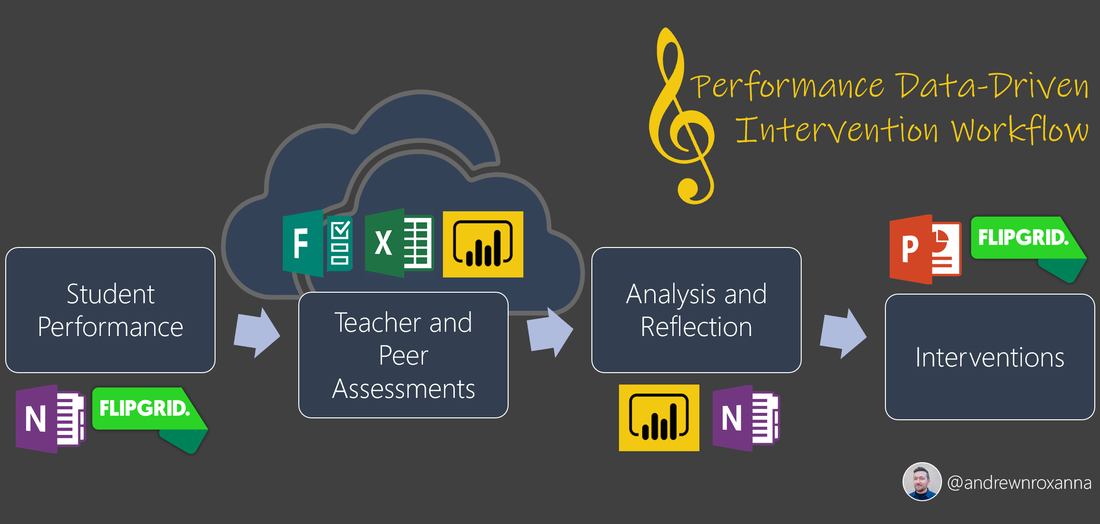
This past school year I took a classroom routine and translated it (I'm currently reading Sonny Magana's T3 book 😉) by integrating Flipgrid and OneNote into the process. This allowed for an increased frequency of student performance submissions, along with the resulting assessment scores from class peers and myself. I was pulling in lots of data. Rubric scores from students and myself, and plenty of feedback comments. The goal was to effectively use this data to help drive instruction and interventions with my students. Based on my previous experience messing around with and sharing student data, I had ideas for what I wanted going into this project:
- I wanted my students to have access to this data
- I wanted the data to reflect their progress/growth over time
- I wanted my students to be have the ability to compare their progress with their instrument section peers and their grade level peers
- I wanted to tie in other data sets I already had access to, was currently collecting, or was planning to collect in the future
- I wanted to be able to use the data as a catalyst for future intervention activities with my students
While I was brainstorming how I would get all the pieces in place to make this work, I had ideas regarding my data organization and management setup:
- I wanted to minimize the amount of data files I was collecting and querying.
- I wanted my data model setup to be as much hands off as possible. In other words, I wanted my setup to include as much automation as possible, reducing the need for me to manually refresh queries myself.
- I wanted to design my own data presentation. I was creating a digital artifact that would be shared back to my students, so I wanted control over how it would look.
- Students would need simple access to the finished product
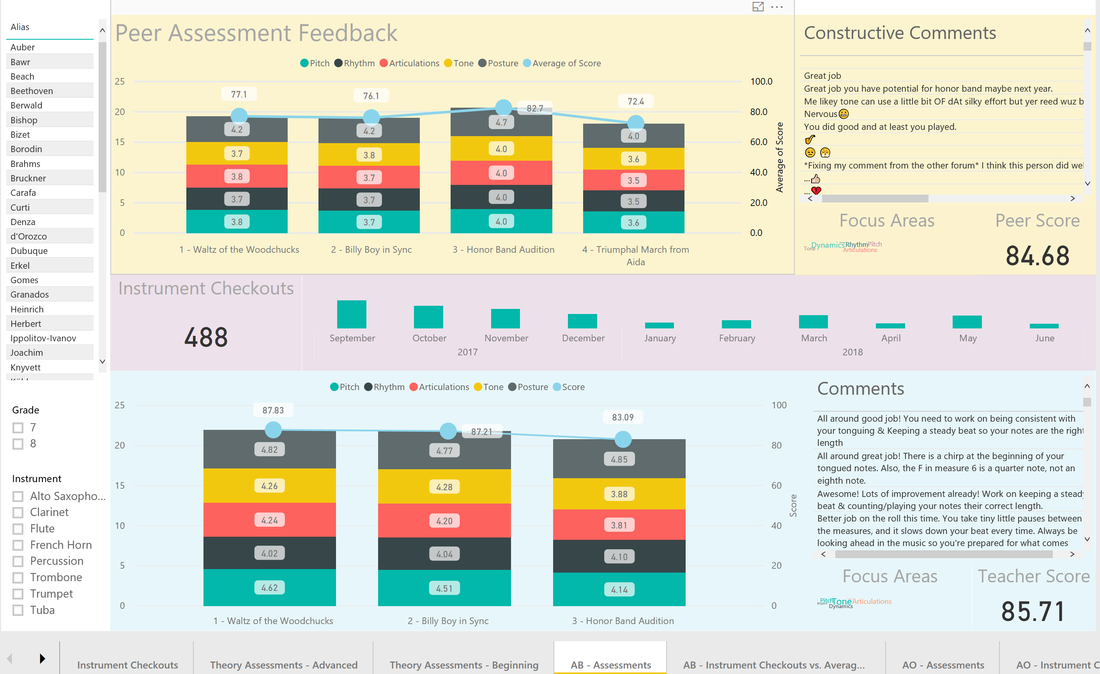
Students were able to select their alias name to filter through the data and see their own stats
For this project I used my go-to data tools I've been messing around with for a few years, Excel and Power Bi. Both are a part of the Office 365 suite, and can connect and talk to each other through OneDrive making the this whole process a lot easier. Excel files are where all my data sets would live, saved into a folder in my OneDrive. Power Bi was used for two different reasons. Data organization and presentation. It brings all the different sets of data together, organizes them, connects them to each other, and allows me to write my own algorithms to get the numbers I'm looking for. At the same time, it provides the canvas and tools for me to design a data visual report that can be shared back to my students. Creating the workflow I wanted required some technology knowledge (TK!) on the different ways the software programs could communicate with each other. I worked my way backward, starting with Power Bi.
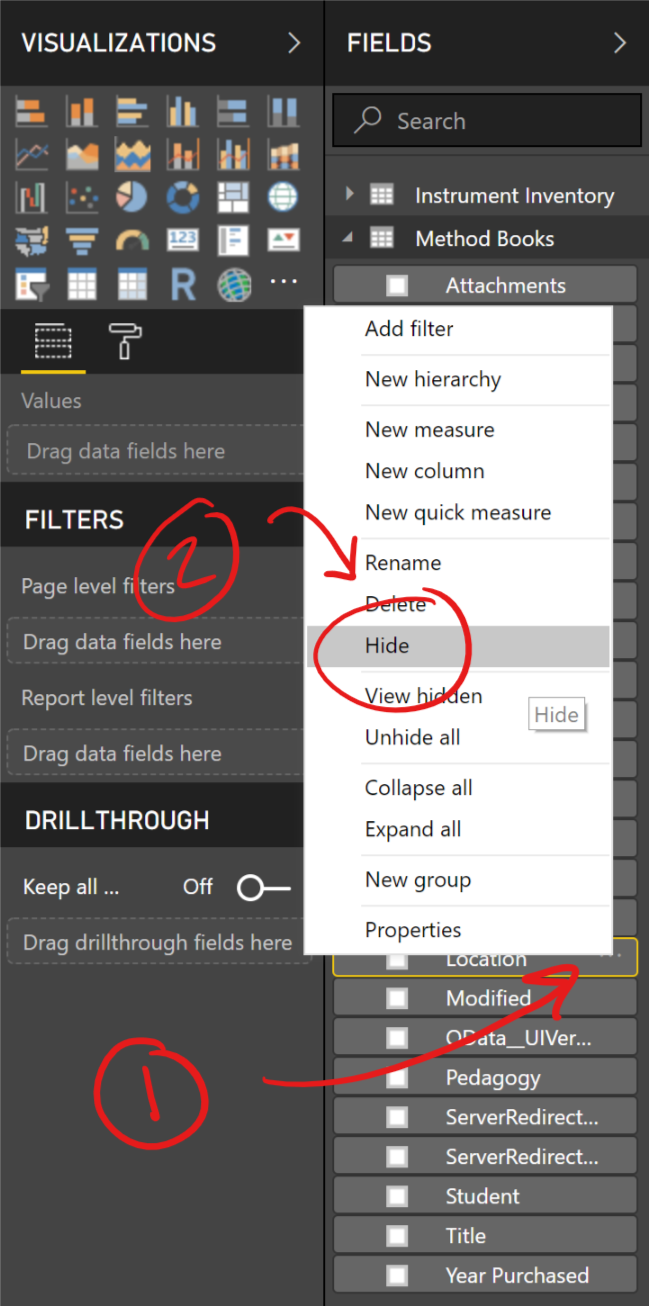 Hiding sensitive information | There are two methods for organizing and creating a Power Bi report. Through the web browser or through the desktop application. Well, last August when I was planning all this I ran into an issue. In order for students to have access to the resulting Power Bi report, the report would have to be shared publicly on the web. That just screams FERPA violation, so I needed a way to anonymize the data and hide any student identifiable information. At the time I was beginning to experiment with the desktop application because it has more bells and whistles for organization and design, and I found my solution from within the program. It was actually pretty simple. Just right click on the specific column of data and select "Hide". That hides any information in that specific column from being seen when people select the "See Records" function in a Power Bi report. I couldn't do that in the web browser version, so now I was going to use the desktop app regardless. |
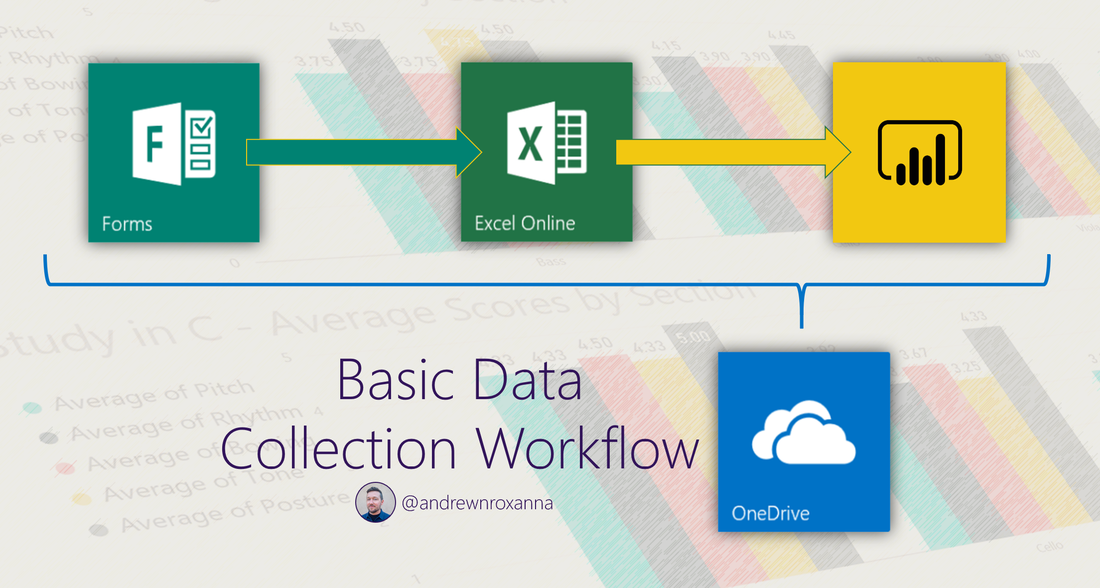
Since I was now using the desktop Power Bi application, and I planned on connecting to Excel files (where the performance assessment data was going to be stored), the Excel files had to be local on my computer. I needed a way to get the data localized, but at the same time I wanted to minimize as much querying as possible. I wanted some automatic data syncing to happen in the background. I figured out how to get that done by using Office Forms. Like any other Form tool, the data submitted through the Form could be exported and associated with an Excel spreadsheet file. However, last summer I found out that after I saved a Form's corresponding Excel file locally to my computer, the connection between the Form and Excel file was severed. New Form responses would not propagate to the Excel file. I found a solution to this, and you can read about it here. By creating a Form from within OneDrive (instead of the Forms tile in the Office 365 waffle), I would get an Office Form/Excel file combo that would continuously sync responses to a localized file on my computer. Now I have one less query for me to do myself 🙂
I created one Office Form for each set of assessment data set per class (Band or Orchestra). One for me to use, and one for my students to use. I did this so I could later do some comparisons between the two data sets in Power Bi. I screen clipped pics of the peer assessment rubric I had previously created, and dumped them into my Office Form. Each rubric category (Pitch, Rhythm, Articulations/Bowings, Tone, Posture) was a multiple choice question in my Form. The choices were 1, 1.5, 2, 2.5, etc. all the way to 5. I also had a comments question too, but because of the way the data would be shared with my students, the comments couldn't include any identifiable information. I had a talk with my students about not inputting any identifiable information such as name, gender, grade, and even a mention of the performer's instrument. It worked, and if a student did accidently type in some identifiable information, they let me know and I was able to delete the string of text from the data set (in the Excel workbook).
I needed a way to get Power Bi to see relationships between my two assessment data sets, so I had to make sure the resulting data tables had columns with the same values. One of the questions I included was "Who are you assessing". This was a multiple choice question with 50 answers, one for every student. When I created this list of student-name answers, I had to make sure each string of text matched the same string of text in the Office 365 directory (when a student fills out the assessment form, the Form captures their name through login credentials and inputs it into the Forms spreadsheet). Apparently at my school hyphenated last names are a growing trend (please stop!), and that can interfere with text string relationships if they don't match. So, if my student's name is "Johnny Bravo-Charlie" in the Office 365 directory, then in my "Who are you assessing" question the Johnny option has to match that same text string. I found this out the hard way 🙃
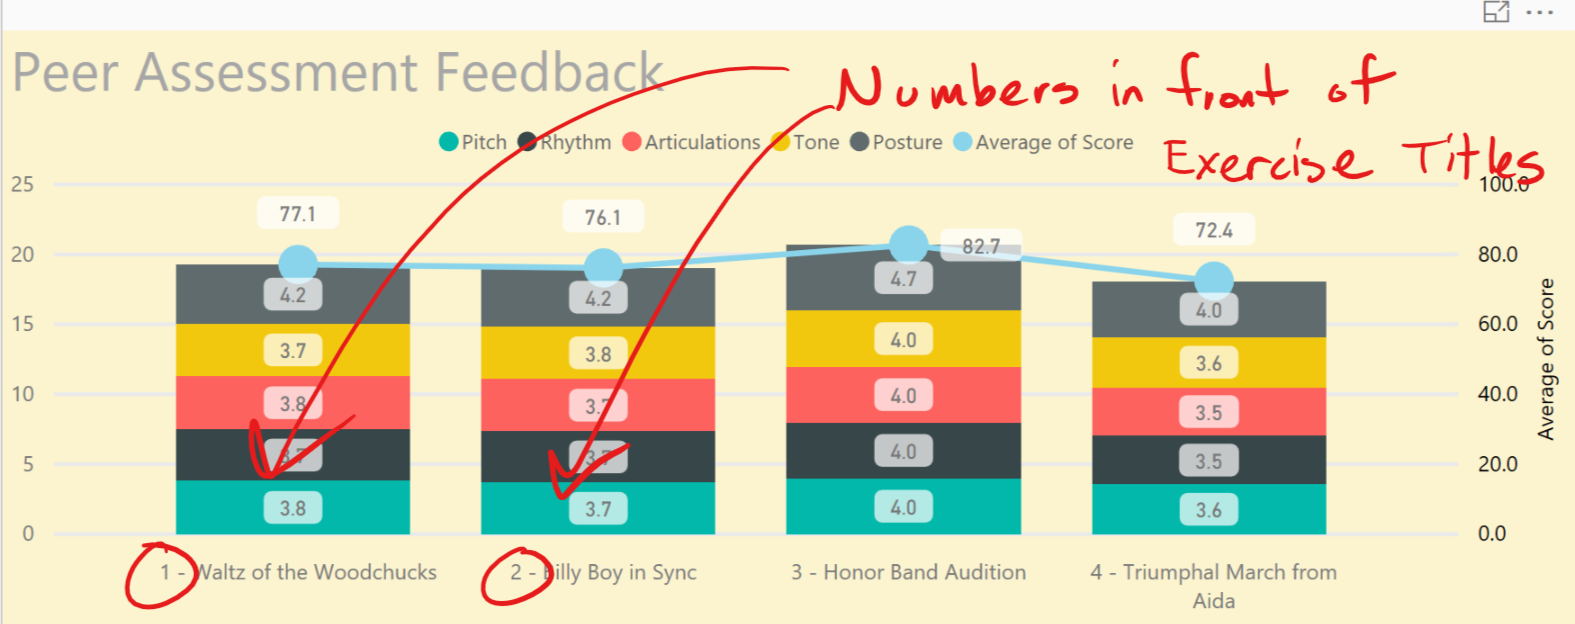
Another question on my Forms was "which video performance are you assessing?" Another multiple choice question, its choices were the exercises the students were performing and recording into Flipgrid. Every time a new performance assessment was assigned to my students, I would just go back to the Form editor and edited the question to include the new assessment option. I wanted the data from these different performance assessments to appear linearly in a data visual, so in front of the title of the assessment exercise I put a number. "1" for the first assessment, "2" for the next one, and so on. This way Power Bi would easily recognize the order I want the assessments to be in. Every once in a while a student would choose the wrong exercise title in their peer assessment submission, but I was able to find the entry in the Excel file and edit the response to include the correct value.
Using this setup I had two sets of data per class that would automatically sync into Excel files saved in my OneDrive. I connected/queried these data tables into my Power Bi desktop file, and started creating my visuals as the data began to flow in. When I was happy with it, I published the report to my Office 365 workspace to make it official. To share it with students, I needed to go to Power Bi in web, find my report and open it up, then select the File-->Publish to Web option to get my sharing link. Sharing it with the students was simple. I could paste the link anywhere in our OneNote Class Notebook and the report would automatically pop up on the page, creating easy access (visually) for my students. Now my students could get the feedback from their peers and me on their performance assessments.
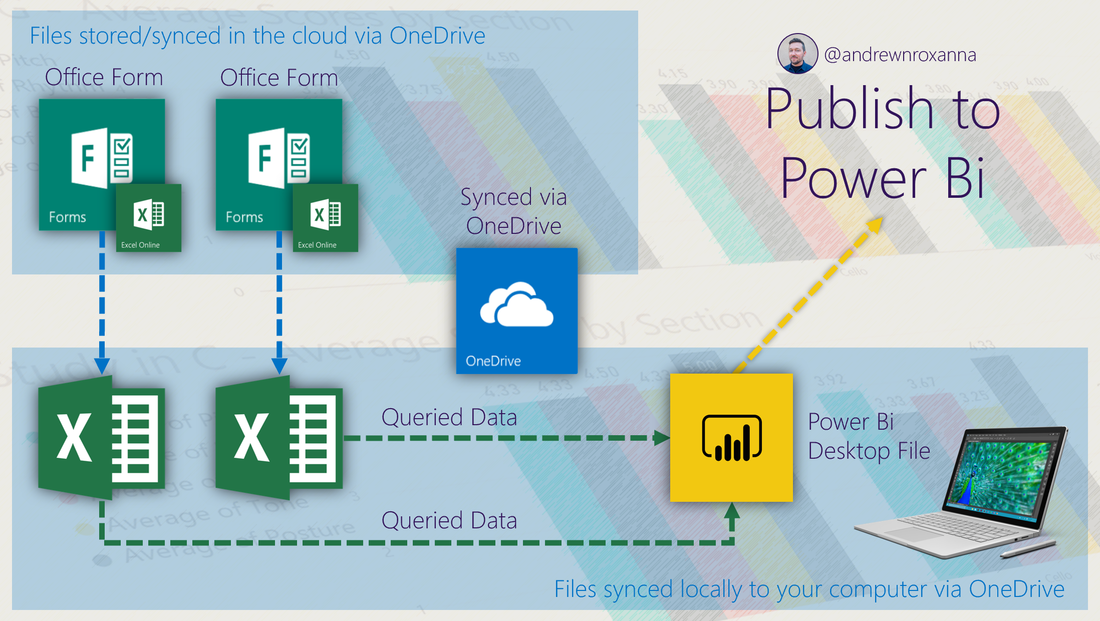
My data collection workflow
It was a bit of work to get this whole system set up, but the best part was after it was done in the beginning of September, my students and I were ready to use for the entire school year. I was able to add more data sets into the report over time (which I did), but my performance/peer assessment workflow was set in place and ready to use.
Part 2 will continue in my next post, where I'll discuss how I used Power Bi to manage all this data.
 RSS Feed
